
1. Introduction
Why a Store-of-Value Index Matters Now: The global economy is entering a new regime—one defined not by cyclical dynamics but by structural, monetary transformation. As governments navigate unsustainable debt levels, policy orthodoxy gives way to financial repression, currency debasement, and inflationary drift. In this uncertain world, the traditional foundations of institutional portfolio construction—equities, bonds, and real assets—are proving incomplete.
This shift demands a rethinking of capital market assumptions (CMAs). In The Case for Store of Value, former Coinbase Asset Management's CIO Marcel Kasumovich outlines why store-of-value assets must be brought into the CMA framework. Unlike productive assets, store-of-value assets—like gold and Bitcoin—derive their value not from yield but from scarcity, neutrality, and trust. Their purpose is not to generate cash flow, but to preserve purchasing power when the system itself is in flux.
Historically, gold fulfilled this role, acting as collateral in times of monetary disorder like the 1930s and 1970s. Now, bitcoin is emerging as its digital counterpart: programmable, decentralized, and scarce by design. Together, these assets form the core of a new monetary hedge—one that complements, rather than replaces, the traditional toolkit.
The opportunity is no longer theoretical. The market value of store-of-value assets is projected to grow from USD 20 trillion to USD 53 trillion by 2034, underpinned by structural fiscal imbalances and accelerating institutional adoption. With expected real returns of 6% over the next decade and diversification benefits uncorrelated to traditional assets, gold and bitcoin are no longer optional—they are strategic.
But with this opportunity comes a practical challenge: how should institutional investors allocate between these two fundamentally different assets? How can one capture bitcoin’s asymmetric upside without taking on excessive volatility? And how can gold’s stability anchor the portfolio without diluting performance?
The Coinbase Store of Value Index (SOV/ SOVG) is our answer.
It translates the macro thesis into a rules-based, volatility-aware strategy that combines gold and bitcoin in a disciplined, adaptive framework. By dynamically allocating based on relative risk and rebalancing quarterly, the index achieves what no static blend can: downside protection with long-term upside capture.
What follows is the methodology behind this strategy—a modern implementation of the store-of-value thesis, purpose-built for portfolios facing the next era of monetary change.
2. Methodology: The Coinbase Store of Value Index
The Coinbase Store of Value Index operationalizes this thesis through a transparent, rules-based strategy that combines gold and Bitcoin using a dynamic, volatility-aware allocation model. This methodology balances gold’s historical reliability with Bitcoin’s asymmetric upside—offering a modern hedge against the very forces undermining traditional CMAs.
A Volatility-Based Allocation Framework: The index allocates more weight to the less volatile asset and rebalances quarterly. This approach preserves risk discipline while capturing upside potential. The result is a portfolio that mirrors gold’s drawdown profile but delivers significantly stronger long-term returns and risk-adjusted metrics.
Rather than choosing between gold and Bitcoin, the index captures both: the legacy store of value and its digital successor. This dual exposure addresses two core institutional imperatives:
- Diversification Against Fiat Risk: As the U.S. fiscal trajectory deteriorates, the Fed may be forced to prioritize financial repression over price stability, introducing long-term risk to bondholders and fiat-denominated wealth.
- Institutional Accessibility: Both Bitcoin and gold are now institutionally accessible through ETFs, custody solutions, and regulated futures. Barriers to entry have materially declined.
- Complementary Hedges: Gold and Bitcoin are not substitutes; they are complementary. Gold excels in periods of macroeconomic stress; Bitcoin thrives in liquidity-driven expansions. Both share one vital trait: they are not liabilities of any government or central bank. The almost zero correlation (Graph 1) makes them ideal portfolio complements.
Graph 1: Bitcoin and gold are largely uncorrelated
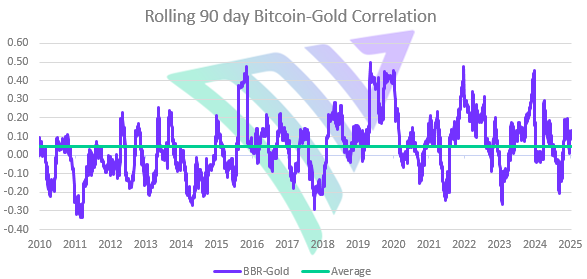
Source: MarketVector, Data as of January 21, 2026. Prices based on the MarketVectorTM Bitcoin Benchmark Rate and GLD.
Strategic Allocation Formula: A static 50/50 Bitcoin-gold allocation is impractical due to Bitcoin’s higher volatility. Likewise, underweighting Bitcoin (e.g., 5% BTC / 95% gold) sacrifices long-term returns.
The Coinbase Store of Value Index solves this through inverse volatility weighting:
Underlying Components:
· SOV (On-Chain version): Bitcoin (BTC), Paxos Gold (PAXG)
· SOVG (Off-Chain version): Bitcoin ETF (IBIT), Gold ETF (GLD)
Let σBTC and σGLD represent the 90-day annualized volatility of Bitcoin and gold, respectively. The weight of each asset is calculated as:

This dynamically tilts the portfolio:
· Away from Bitcoin during periods of elevated volatility.
· Towards Bitcoin when volatility subsides, creating a disciplined buy-low, sell-high mechanism.
· Quarterly rebalancing ensures responsiveness without excessive turnover.
Performance
Table 1: Performance Metrics (2017–2025)
|
Total Return |
CAGR |
Sharpe Ratio |
Sortino Ratio |
Gain-Pain Ratio |
Max Draw-down |
Ann. Volat-ility |
Longest DD Period |
Av. DD Period |
||
BM 50/50 |
5056% |
55% |
1.22 |
1.85 |
1.23 |
-60% |
39% |
952 |
31 |
|
|
BM 5/95 |
491% |
22% |
1.12 |
1.66 |
1.25 |
-22% |
15% |
629 |
23 |
|
|
COINSOV |
1172% |
32% |
1.29 |
1.90 |
1.27 |
-28% |
20% |
598 |
21 |
|
|
COINSOVG |
1081% |
31% |
1.30 |
1.95 |
1.28 |
-29% |
19% |
1009 |
25 |
|
|
Bitcoin |
9264% |
65% |
1.01 |
1.52 |
1.18 |
-84% |
69% |
1078 |
53 |
|
|
Gold |
305% |
17% |
0.85 |
1.24 |
1.22 |
-22% |
15% |
1305 |
40 |
|
|
Source: MarketVector, Ratios based on December 31, 2016 to January 21, 2026.
Backtested from 2017 to 2025, the Coinbase Store of Value Index:
Outperforms all static Bitcoin-gold blends with a similar weighting profile in total return. The 50/50 allocation has significantly higher risk.
· Maintains a drawdown profile like gold.
· Delivers the highest Sharpe and Sortino Ratio among evaluated strategies.
The chart below (Graph 2) shows the cumulative performance of various Bitcoin–Gold allocation strategies, all indexed to 100 as of January 2017. With the exception of the 50/50 Bitcoin–Gold allocation, the Coinbase Store of Value Index outperforms all static benchmark mixes over the entire period.
Graph 2: The Coinbase Store of Value Index strikes an optimal balance
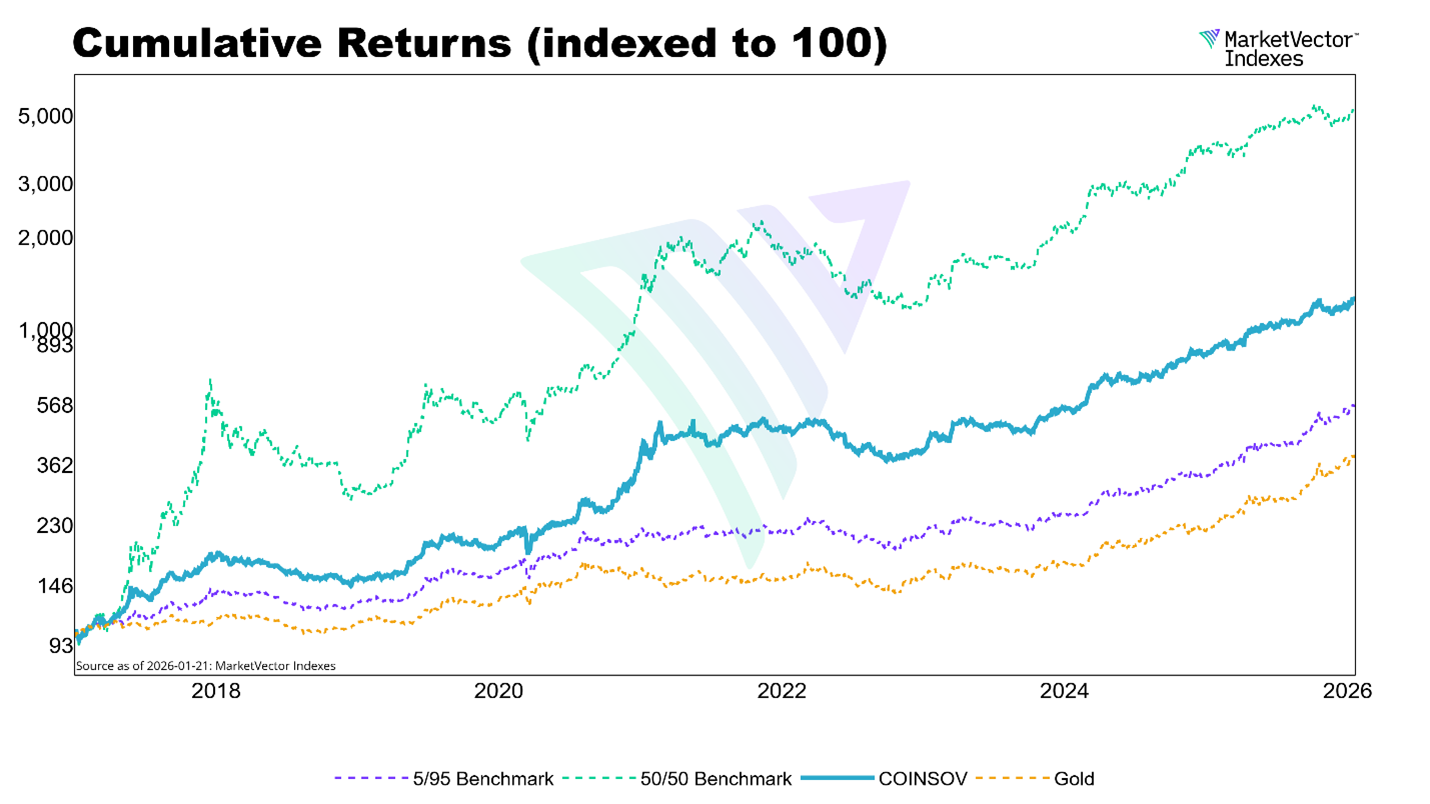
Source: MarketVector, Data as of January 21, 2026. Prices based on the Bitcoin Benchmark Rate and GLD ETF.
Notably, while the 50/50 Bitcoin–Gold allocation delivers strong returns, it also comes with higher volatility and deeper drawdowns. More conservative mixes, such as the 5/95 benchmarks, lag meaningfully in performance—underscoring the opportunity cost of an overly cautious positioning compared to the Coinbase Store of Value Index.
Gold-only (GLD) strategies deliver the least return, consistent with their role as stability anchors rather than growth drivers. The Coinbase approach, by dynamically adjusting to relative volatility, strikes an optimal balance—delivering long-term upside while mitigating downside risk.
Drawdown Comparison: Despite allocating to a volatile asset like Bitcoin, the index’s worst drawdown is only modestly deeper than gold’s, coming in at -28% versus gold’s -22% (Graph 3). This is a critical behavioral advantage—it mitigates the emotional decision-making that often leads investors to exit positions prematurely. In contrast, static 50/50 portfolios suffer significantly deeper drawdowns, exposing the cost of ignoring volatility.
Graph 3: Coinbase Store of Value similar to Gold in terms of Drawdowns
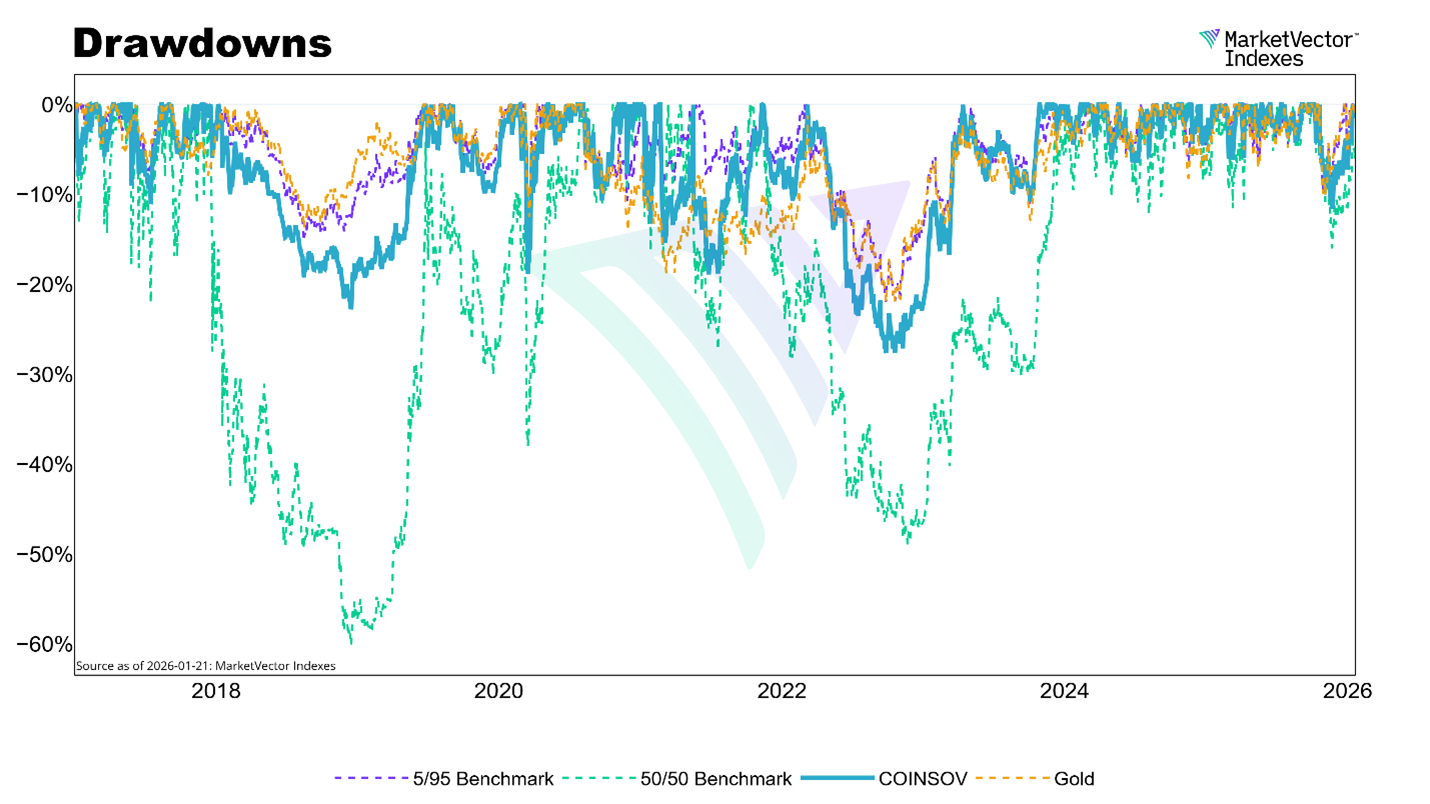
Source: MarketVector, Data as of January 21, 2026. Prices based on the Bitcoin Benchmark Rate and GLD.
The risk–return scatter plot reinforces these insights. Graph 4 depicts the relationship between the compound annual growth rate (CAGR) and the Sharpe Ratio across a range of portfolio strategies, illustrating the trade-off between return potential and downside risk. The Coinbase strategy (BBR–Gold Inverse Volatility portfolio) stands out with superior risk-adjusted performance—combining a high CAGR with the highest Sharpe Ratio among all strategies analyzed. This highlights the importance of using risk-adjusted measures such as the Sharpe Ratio to more accurately assess portfolio efficiency.
Graph 4: The Coinbase strategy demonstrates superior risk-adjusted performance
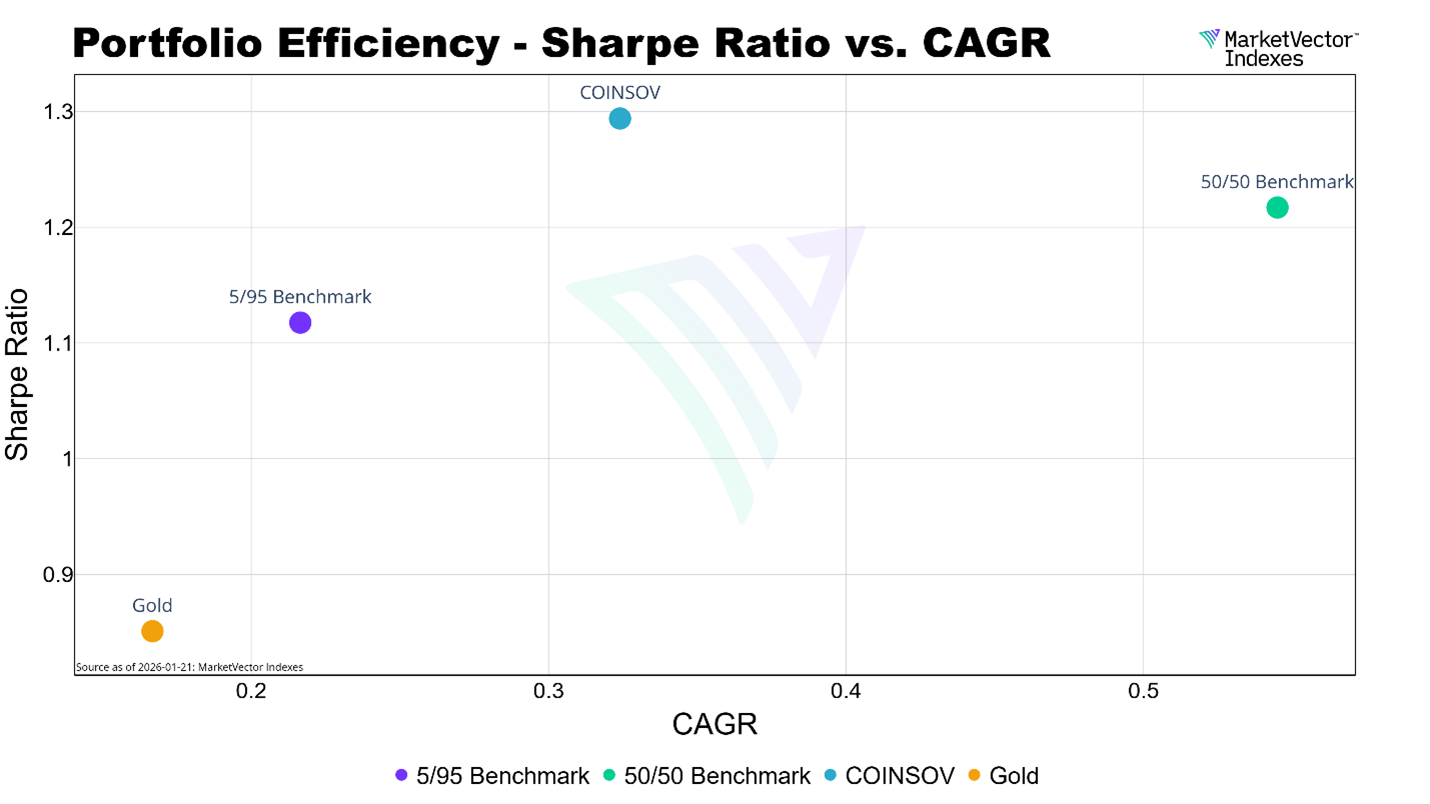
Source: MarketVector, Data as of January 21, 2026. Prices based on the Bitcoin Benchmark Rate and GLD.
Graph 5 illustrates the quarterly returns distribution for the Coinbase Store of Value Index (purple line), which applies an inverse volatility-weighted allocation, and for Gold (green line). The histogram highlights the asymmetry of the strategy’s payoff. Gold’s return profile is narrow and stable, while the index exhibits a broader, right-skewed distribution. This means the index captures more high-return quarters, reflecting successful tactical allocation toward Bitcoin during calm periods. The heavier right tail reinforces the index’s potential to outperform without disproportionately increasing downside risk.
Graph 5: The Coinbase Store of Value Index shows more positive skew
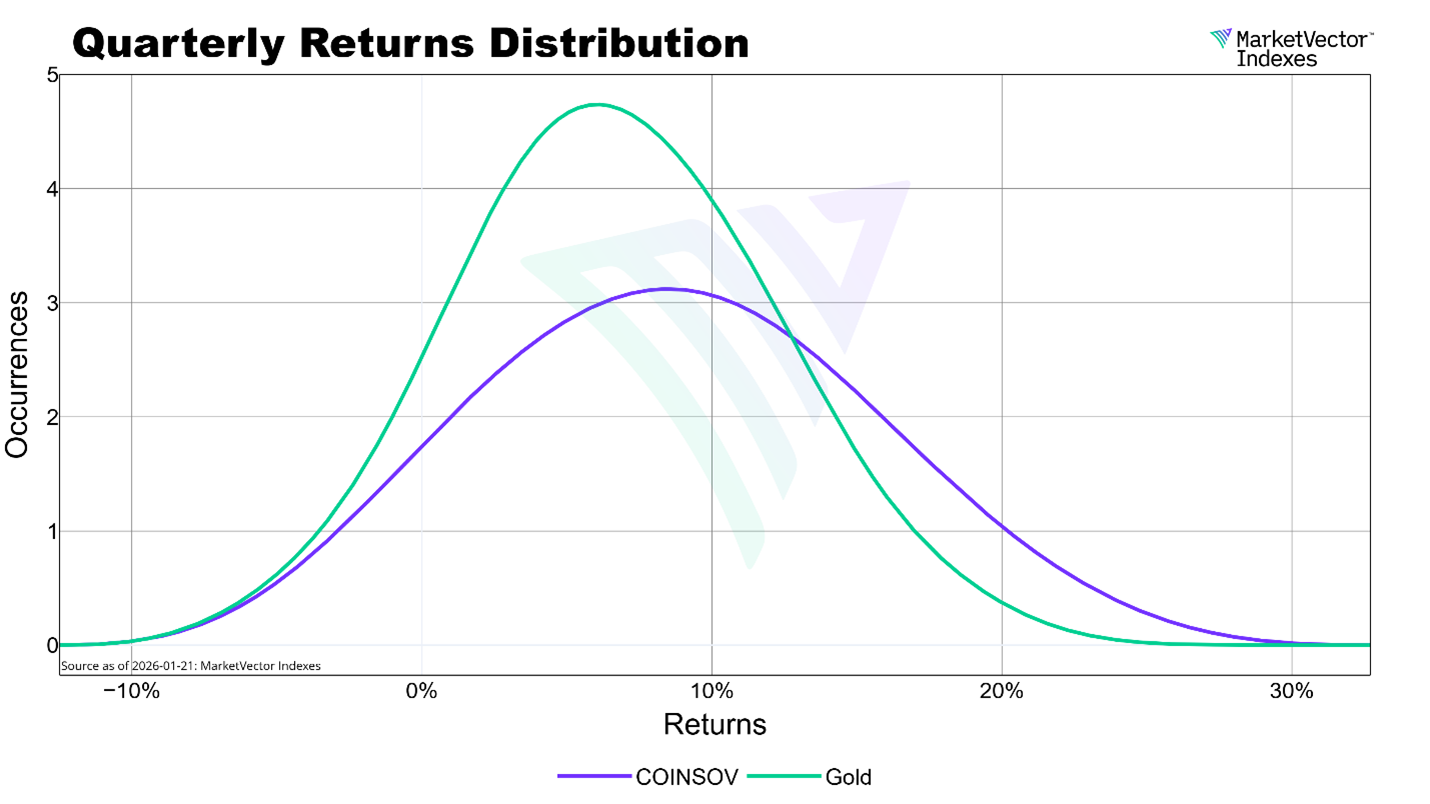
Source: MarketVector, Data as of January 21, 2026. Prices based on the Bitcoin Benchmark Rate and GLD.
Behavioral Advantage: Buy-Low, Sell-High Mechanism. This inverse volatility approach embeds a counter-cyclical mechanism:
· In bull markets, when Bitcoin volatility rises, the strategy reduces exposure.
· In bear markets, when Bitcoin sells off and volatility falls, it adds exposure.
This is the opposite of typical investor behavior and corrects for emotion-driven errors. It enforces discipline and creates a systematic framework for capitalizing on Bitcoin’s asymmetric upside while managing risk through gold.
Graph 6: Buy Low, Sell High Mechanism
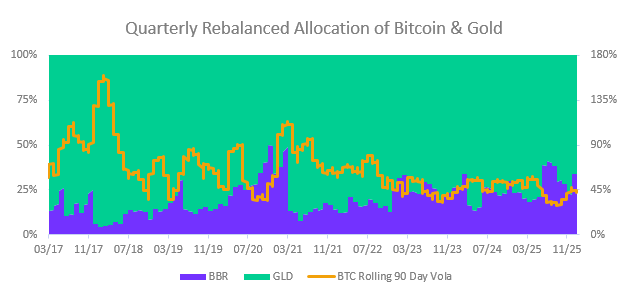
Source: MarketVector, Data from March 15, 2017 to January 21,2026. Weights based on the MarketVectorTM Bitcoin Benchmark Rate and GLD.
Graph 6 illustrates the quarterly rebalanced allocation between Bitcoin and gold based on inverse volatility. Importantly, Bitcoin exhibits a unique behavior: volatility tends to increase dramatically during bull markets—often accompanying explosive price appreciation.
This is unlike traditional assets, where volatility typically spikes during market declines. The strategy helps harvest this asymmetric characteristic by reducing exposure when Bitcoin’s volatility rises (often alongside price) and increasing exposure when markets calm.
This makes it a systematic 'buy low, sell high' framework, purpose-built for Bitcoin’s structural volatility profile.
3. Conclusion
A 21st Century Store-of-Value Solution. In a world shaped by fiscal dominance, conventional risk-free assets can no longer be relied on to preserve purchasing power. The combination of Bitcoin and gold—allocated through a volatility-aware framework—offers investors a robust, adaptive, and forward-looking store-of-value strategy.
The Coinbase Store of Value Index provides exactly this: a rules-based, transparent approach that honors the timeless utility of gold while embracing the disruptive potential of Bitcoin. As economic uncertainty deepens and monetary orthodoxy erodes, this strategy offers a new foundation for capital preservation.
Get the latest news & insights from MarketVector
Get the newsletterRelated:
Most popular
-
 Commentary
Goal! Small Country, Big Impact
-
 Commentary
Hidden GEMs: Ukraine