.png)
Abstract
The debate over whether Bitcoin qualifies as a store of value has intensified, with critics pointing to its volatility and deep drawdowns as disqualifying factors. However, this analysis reveals that when examining historical data on traditional store of value assets, particularly gold and silver, extended drawdown periods are not anomalous but intrinsic to these asset classes.
This paper argues that the defining characteristics of a store of value are rooted in its fundamental attributes: scarcity, lack of a central issuer, and resistance to arbitrary supply expansion. By comparing gold, silver, and Bitcoin across these dimensions, and analyzing their correlation patterns, we demonstrate that Bitcoin's low correlation with gold (averaging 0.058) creates compelling diversification benefits.
The Coinbase Store of Value Index (COINSOVG), which uses inverse volatility weighting to dynamically allocate between Bitcoin and gold, exemplifies how investors can capture Bitcoin's asymmetric upside while maintaining gold's stability, achieving superior risk-adjusted returns compared to static allocations.
1. Introduction: The Store of Value Debate
The question of what constitutes a true store of value has become increasingly contentious in financial discourse. Bitcoin's emergence as a potential store of value has sparked vigorous debate, with skeptics frequently citing its volatility and substantial drawdowns as evidence of its unsuitability for this role. The critique follows a familiar pattern: "How can an asset that declined 84% from peak to trough be considered a store of value?"
This perspective, while superficially compelling, reveals a fundamental misunderstanding of what defines store of value assets. It conflates short-to-medium term price stability with the deeper structural attributes that have historically made assets reliable stores of value across centuries and civilizations. When we examine gold -the archetypal store of value asset -and its companion precious metal silver, we discover that significant drawdowns are not aberrations but characteristic features of these assets throughout modern financial history.
This paper advances a different framework for evaluating store of value assets, one centered on fundamental attributes rather than price volatility metrics. We argue that the critical characteristics are: (1) absolute scarcity or highly constrained supply, (2) absence of a central issuer or controlling authority, and (3) resistance to arbitrary monetary expansion. Through comparative analysis of gold, silver, and Bitcoin across these dimensions, combined with empirical examination of their correlation patterns and drawdown behaviors, we demonstrate that Bitcoin's inclusion alongside gold in a properly structured portfolio offers compelling diversification benefits unavailable through precious metals alone.
2. Drawdowns Don't Disqualify: Learning from Precious Metals
2.1 Gold's Drawdown History
Gold, universally acknowledged as the quintessential store of value, has experienced prolonged and severe drawdowns throughout the modern era. Figure 1 illustrates gold's performance since 1975, revealing maximum drawdowns exceeding 65% that persisted for decades.
Figure 1: Gold Performance Analysis (1975-2026)
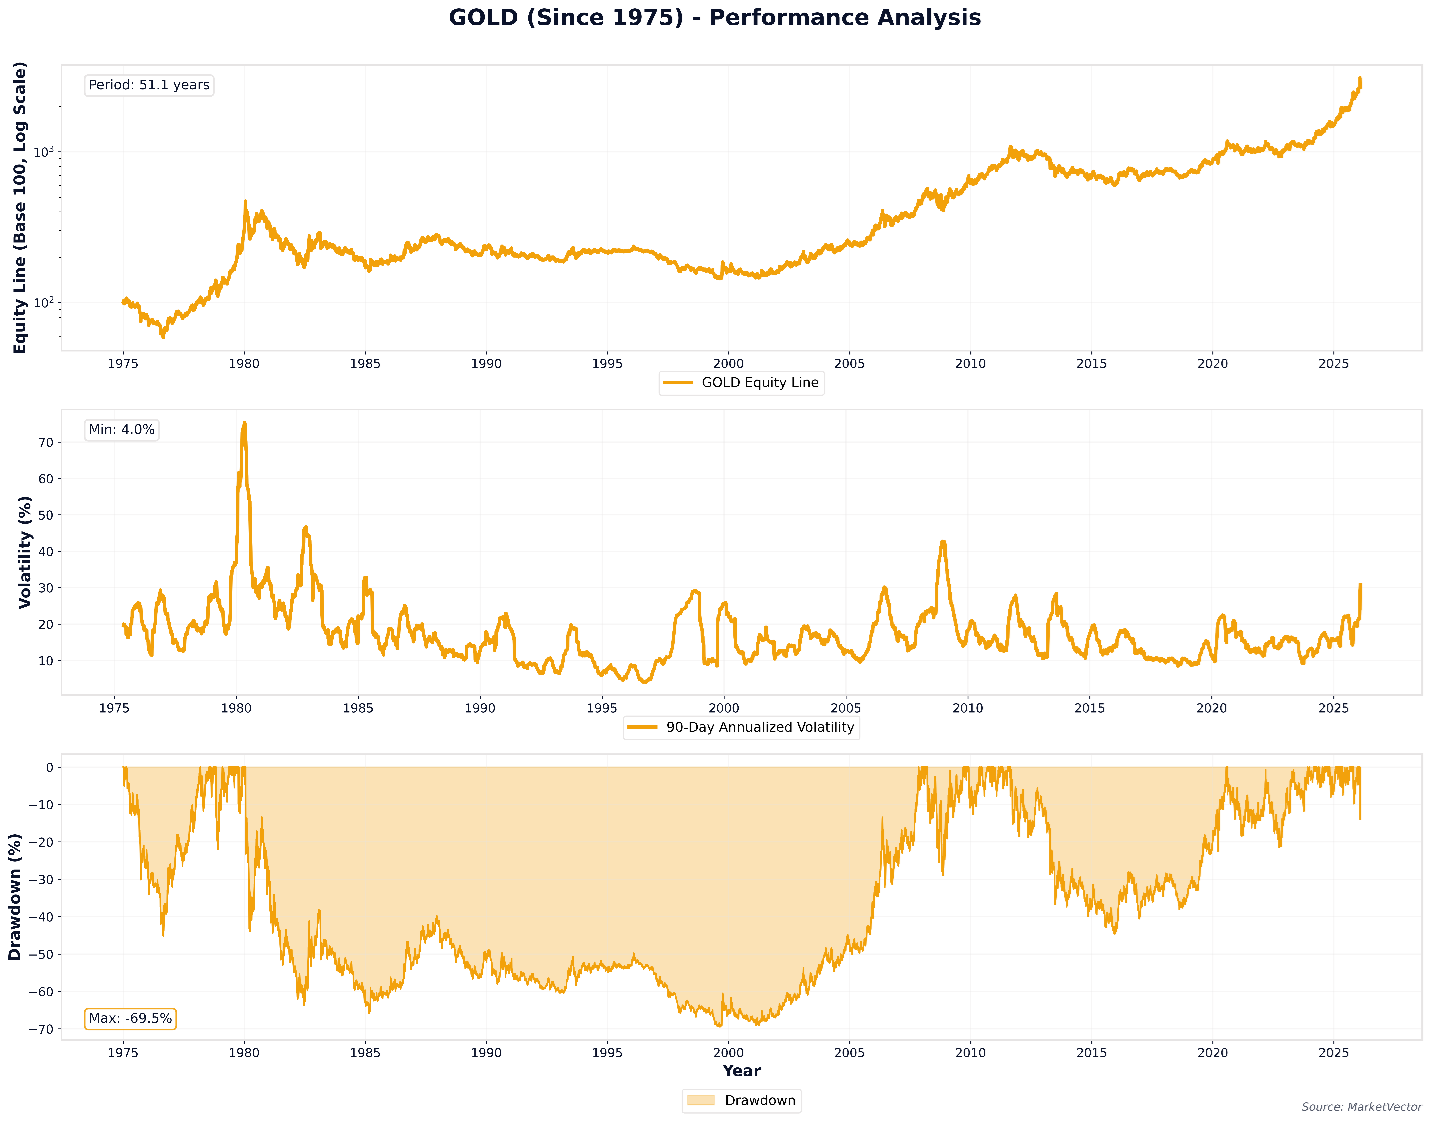
The data reveals critical insights:
- Gold experienced a maximum drawdown of approximately 65% during the extended period from the early 1980s through 2001, a bear market lasting roughly two decades.
- Even during its recent bull phase (2019-2025), gold has exhibited drawdowns approaching 30%.
- Volatility, while lower than Bitcoin's, has ranged from 10% to over 70% during crisis periods, with minimum volatility at 4%.
Despite these substantial and prolonged price declines, gold's status as a store of value was never seriously questioned. Why? Because its value proposition rests not on short-term price stability but on its unchanging fundamental attributes: fixed supply constraints, lack of counterparty risk, and resistance to governmental monetary manipulation.
2.2 Silver's Even More Volatile Profile
Silver, also categorized as a monetary metal and store of value, exhibits even more pronounced volatility and drawdown characteristics than gold, as shown in Figure 2.
Figure 2: Silver Performance Analysis (1975-2026)
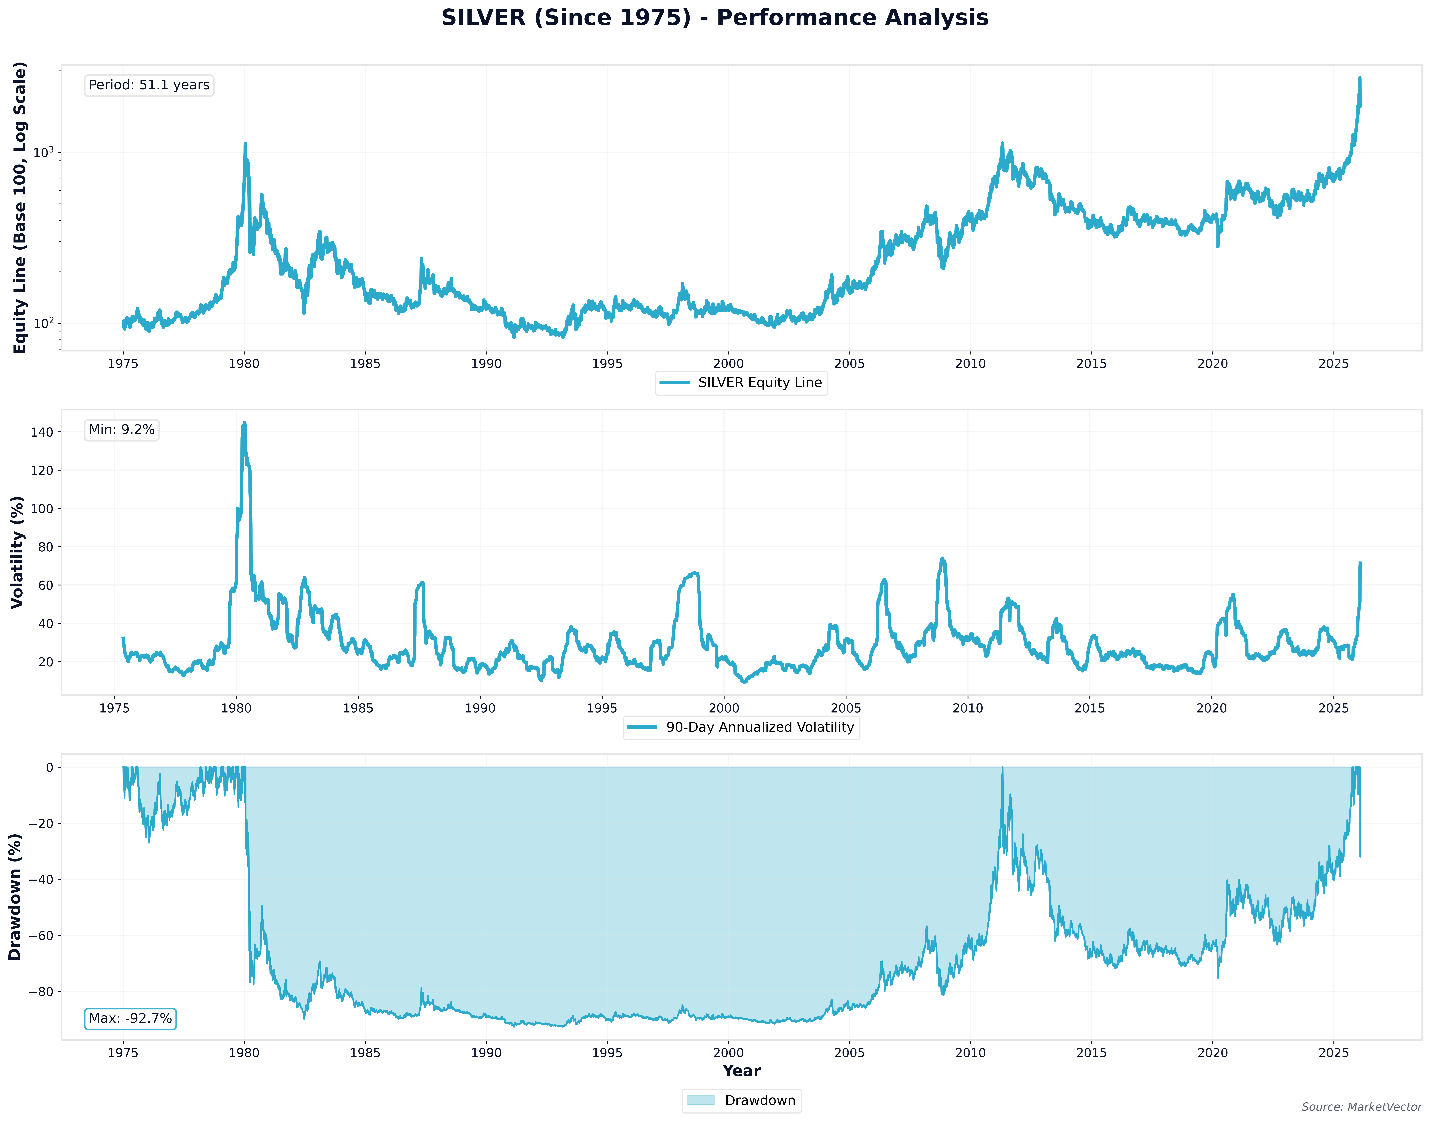
Silver's drawdown profile is striking:
- Maximum drawdown exceeds 90%, surpassing even Bitcoin's worst drawdowns.
- Multiple distinct drawdown periods exceeding 80% occurred across different decades.
- Volatility ranges from a minimum of 9.2% to peaks exceeding 140%, demonstrating greater price instability than either gold or Bitcoin in certain periods.
Despite this extreme volatility profile, silver maintains its classification as a precious metal and store of value. Its industrial applications combined with monetary properties create a more volatile asset than pure monetary metals, yet its fundamental attributes -scarcity, difficult extraction, no central issuer -preserve its store of value status.
2.3 Bitcoin in Context
When we place Bitcoin's drawdown profile alongside gold and silver (Figure 3), we observe that its volatility and drawdown characteristics, while elevated, fall within the range established by accepted store of value assets, particularly silver.
Figure 3: Bitcoin Performance Analysis (2010-2026)
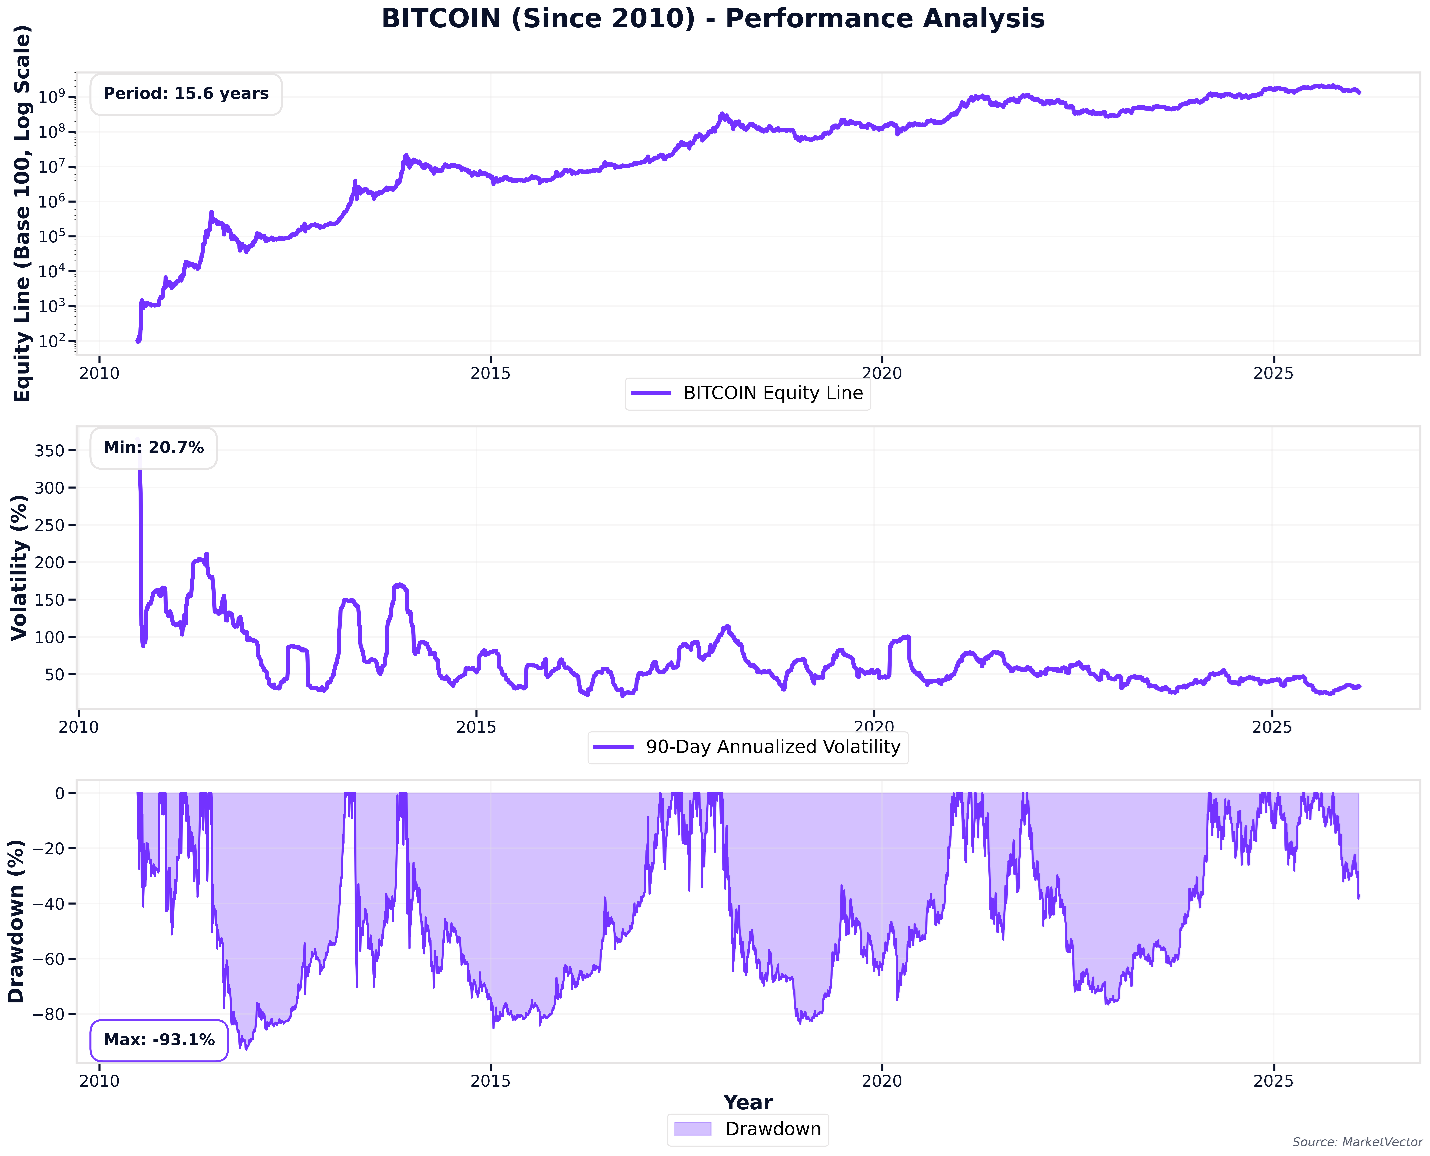
Bitcoin's profile reveals:
- Maximum drawdown of approximately 84%, comparable to silver's worst periods but occurring over shorter timeframes.
- Volatility declining over time as the asset matures, with recent 90-day annualized volatility in the 20-40% range, still elevated relative to gold but trending downward as the market deepens.
- Recovery periods that, while psychologically challenging, have consistently resolved to new all-time highs, a pattern consistent with adoption-phase assets gaining monetary premium.
The critical insight: If we accept gold with its 65% drawdown and two-decade bear market as a store of value, and if we accept silver with its 90%+ drawdown as a store of value, then rejecting Bitcoin solely on volatility metrics while its fundamental attributes are arguably superior represents an inconsistent analytical framework.
3. Attributes Define Store of Value, Not Price Behavior
The enduring store of value property of gold and silver derives not from their price stability—which, as demonstrated, is questionable—but from their immutable physical and economic attributes. We propose evaluating store of value assets across three critical dimensions: absolute scarcity, absence of central control, and resistance to supply manipulation.
Table 1: Comparative Store of Value Attributes
Attribute |
Gold |
Silver |
Bitcoin |
Absolute Scarcity |
~2% annual growth; finite but unknown total |
~3% annual growth; more abundant than gold |
Fixed at 21 million; decreasing issuance via halving |
Central Issuer |
None; geological constraints only |
None; geological constraints only |
None; protocol enforced by distributed consensus |
Supply Manipulation Risk |
Mining technology advances could increase supply |
Higher than gold; significant industrial recycling |
Impossible without network consensus; mathematically enforced |
Verifiability |
Assay required; counterfeiting possible |
Assay required; counterfeiting possible |
Instant cryptographic verification; impossible to counterfeit |
Portability |
Heavy; expensive to transport and secure |
Heavy; expensive to transport and secure |
Infinitely divisible; instant global transfer at minimal cost |
Seizure Resistance |
Physical storage vulnerable; historically confiscated |
Physical storage vulnerable; historically confiscated |
Can be memorized via seed phrase; resistant to physical seizure |
This analysis reveals that Bitcoin possesses superior attributes across multiple dimensions critical to the store of value function. Its absolute scarcity is mathematically guaranteed - a property neither gold nor silver can claim. The absence of a central issuer combined with cryptographic verification creates a trust model fundamentally different from physical commodities that require assay and secure storage. While gold and silver have served admirably for millennia, Bitcoin represents an evolutionary advance in monetary technology specifically designed to address the shortcomings of both fiat currency and precious metals in the digital age.
4. Correlation Benefits: Why Bitcoin and Gold Are Complementary
Beyond their shared store of value attributes, the correlation patterns between Bitcoin, gold, and silver reveal compelling portfolio construction insights. The near-zero correlation between Bitcoin and gold creates diversification benefits unavailable through precious metals allocations alone.
4.1 The Bitcoin-Gold Correlation Profile
Figure 4: Gold-Bitcoin 90-Day Rolling Correlation (2010-2026)
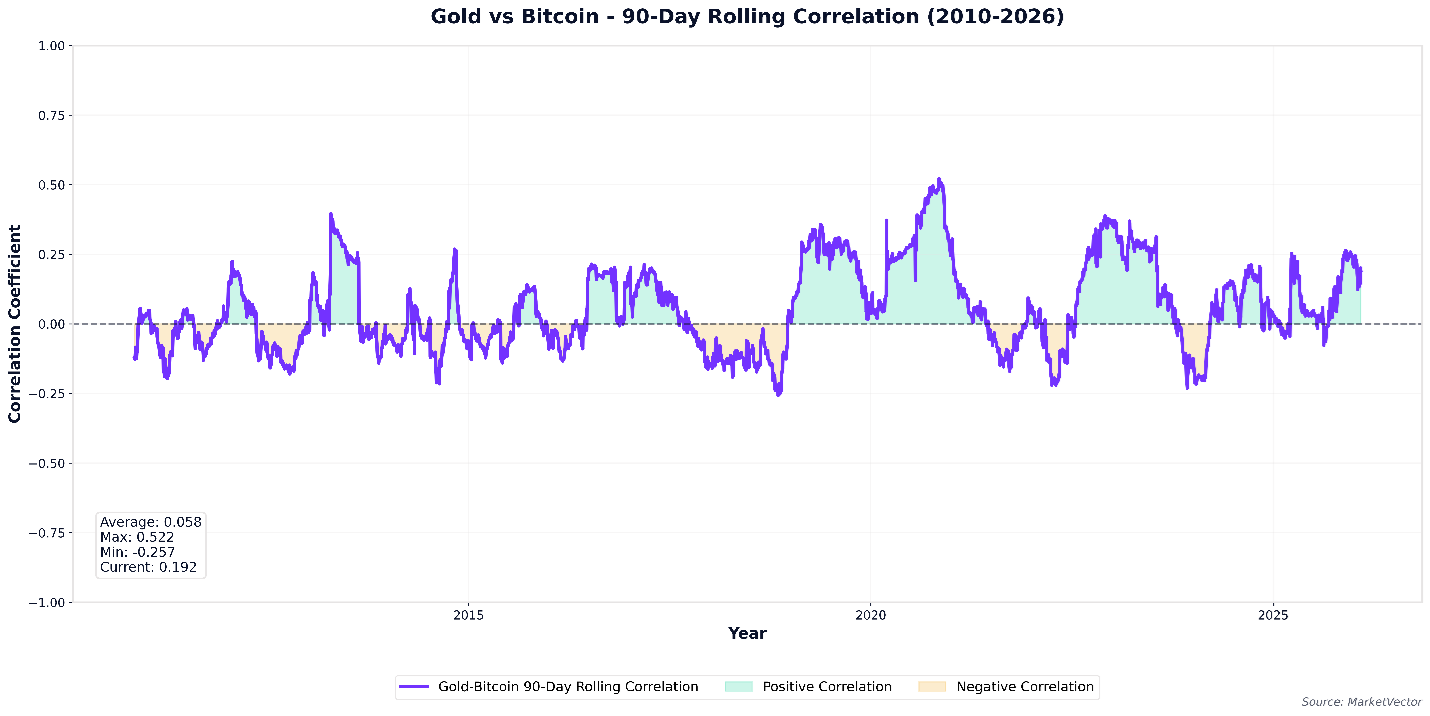
Figure 4 demonstrates that the correlation between Bitcoin and gold averages 0.058, essentially zero with substantial variation around this mean. The correlation oscillates between approximately -0.26 and +0.52, never establishing a persistent positive or negative relationship. This pattern reveals several critical insights:
- Bitcoin and gold respond to different market drivers. Gold tends to perform well during macroeconomic stress and currency debasement concerns, while Bitcoin has historically shown strength during liquidity-driven expansions and risk-on environments.
- The low correlation is not an artifact of a particular market regime but persists across the entire observation period, encompassing multiple Bitcoin market cycles and various gold market conditions.
- Recent periods (2020-2026) have shown slightly elevated correlation, potentially reflecting Bitcoin's maturation and growing recognition as a macro hedge, but the relationship remains weak.
From a portfolio construction perspective, this near-zero correlation creates genuine diversification. When gold underperforms due to real interest rate increases or US dollar strength, Bitcoin may outperform due to technological adoption narratives or liquidity abundance. Conversely, during Bitcoin bear markets driven by regulatory concerns or market structure issues, gold may provide stability. The two assets offer complementary exposures to monetary debasement risk through fundamentally different channels.
4.2 The Gold-Silver Correlation Contrast
Figure 5: Gold-Silver 90-Day Rolling Correlation (1975-2026)
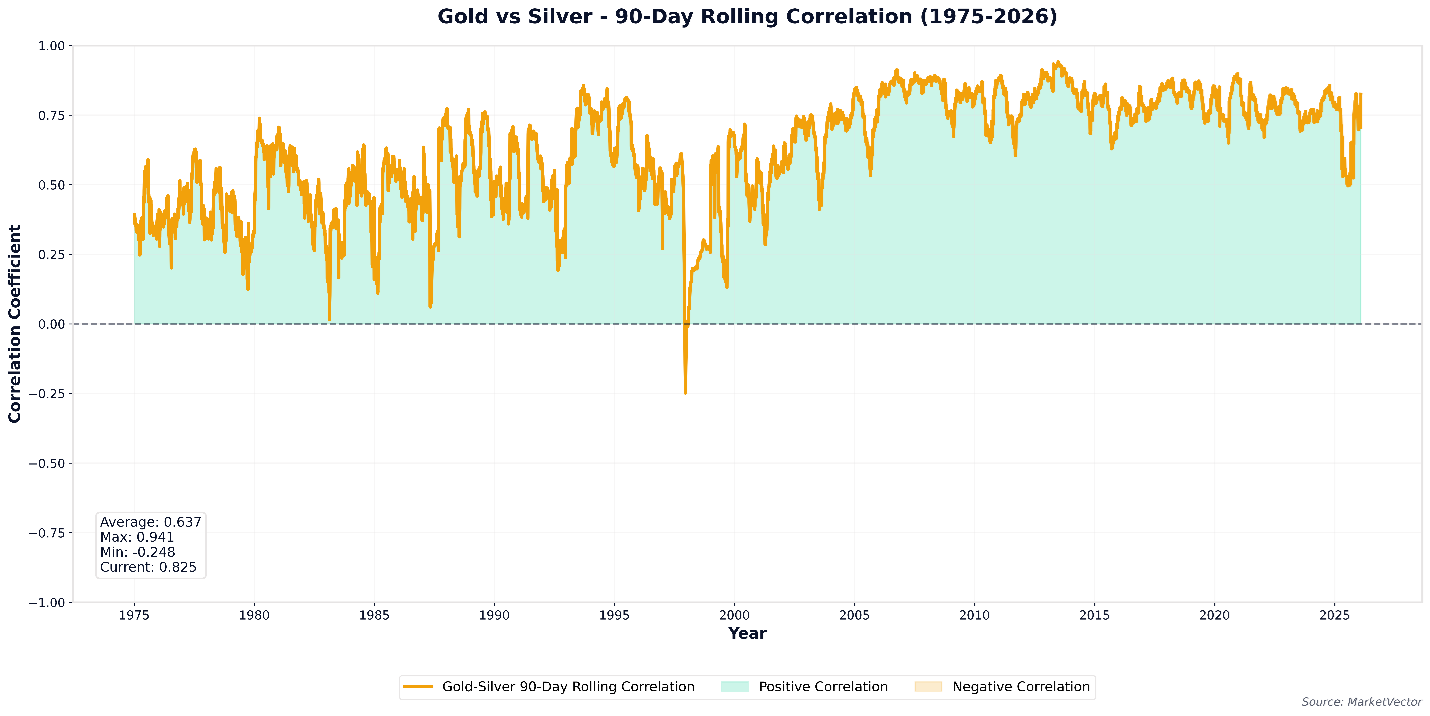
In contrast to the Bitcoin-gold relationship, Figure 5 reveals that gold and silver maintain a strong positive correlation averaging 0.637, with the correlation consistently remaining in positive territory except during brief anomalous periods. The gold-silver correlation has strengthened over time, recently stabilizing in the 0.75-0.85 range.
This high correlation exists because:
- • Both metals share similar supply dynamics constrained by geological scarcity and mining economics.
- Both respond similarly to real interest rates, currency movements, and inflation expectations.
- Silver's industrial applications create additional volatility but don't fundamentally alter its monetary metal characteristics or its co-movement with gold.
The portfolio implication is clear: holding both gold and silver provides limited incremental diversification benefit compared to gold alone. An investor seeking precious metals exposure for store of value purposes gains little by splitting allocation between gold and silver versus concentrating in gold. In contrast, combining gold with Bitcoin creates a fundamentally different diversification profile due to their near-zero correlation, offering exposure to store of value attributes through two uncorrelated return streams.
5. The Coinbase Store of Value Index: A Practical Implementation
Having established that (1) drawdowns don't disqualify store of value assets, (2) fundamental attributes matter more than price behavior, and (3) Bitcoin and gold offer complementary exposures, the question becomes: how should investors practically allocate between these assets? The Coinbase Store of Value Index (COINSOVG) provides an elegant solution through inverse volatility weighting.
5.1 Methodology: Inverse Volatility Weighting
The index allocates between Bitcoin (via IBIT ETF) and gold (via GLD ETF) using a rules-based inverse volatility approach:
- Calculate 90-day annualized volatility for both Bitcoin and gold
- Allocate inversely to volatility: higher allocation to the less volatile asset
- Rebalance quarterly to maintain risk discipline without excessive turnover
This approach embeds a counter-cyclical buy-low, sell-high mechanism. During Bitcoin bull markets when volatility typically rises with price, the index reduces Bitcoin exposure, booking profits into gold. During Bitcoin corrections when volatility declines, the index increases Bitcoin exposure, systematically buying at lower prices. This is precisely opposite to typical investor behavior, providing disciplined exposure management without attempting to time markets through discretionary decisions.
5.2 Performance Characteristics
Backtested from December 31, 2016 through January 21, 2026, the Coinbase Store of Value Index (COINSOVG) has delivered:
|
Total Return |
CAGR |
Sharpe Ratio |
Sortino Ratio |
Gain-Pain Ratio |
Max Draw-down |
Ann. Volat-ility |
Longest DD Period |
Av. DD Period |
||
BM 50/50 |
5056% |
55% |
1.22 |
1.85 |
1.23 |
-60% |
39% |
952 |
31 |
|
|
BM 5/95 |
491% |
22% |
1.12 |
1.66 |
1.25 |
-22% |
15% |
629 |
23 |
|
|
COINSOVG |
1081% |
31% |
1.30 |
1.95 |
1.28 |
-29% |
19% |
1009 |
25 |
|
|
Bitcoin |
9264% |
65% |
1.01 |
1.52 |
1.18 |
-84% |
69% |
1078 |
53 |
|
|
Gold |
305% |
17% |
0.85 |
1.24 |
1.22 |
-22% |
15% |
1305 |
40 |
|
|
Table 2: Source: MarketVector, Ratios based on December 31, 2016 to January 21, 2026.
The results are compelling:
- COINSOVG delivers 31% CAGR with only 19% annualized volatility, double the returns of gold with comparable volatility to a conservative 5/95 static mix.
- The maximum drawdown of -29% is only 7 percentage points worse than gold's -22%, yet the strategy captured significant upside during Bitcoin's appreciation phases.
- The Sharpe ratio of 1.30 and Sortino ratio of 1.95 exceed all comparison strategies, indicating superior risk-adjusted performance on both total volatility and downside risk metrics.
- Compared to a 50/50 static allocation, COINSOVG achieves similar Sharpe ratio performance while reducing maximum drawdown from -60% to -29% -a critical behavioral advantage for maintaining investor commitment during stress periods.
The index strikes an optimal balance: it captures meaningful Bitcoin exposure during calm markets when the asset is less volatile, then automatically reduces exposure during volatile periods. This disciplined approach prevents the common investor error of buying high and selling low, instead systematically implementing the opposite behavior through a rules-based framework.
5.3 Why This Approach Works
The Coinbase Store of Value Index succeeds because it addresses three critical challenges facing investors evaluating Bitcoin and gold allocations:
- The Allocation Dilemma: Static allocations force investors to choose between excessive Bitcoin exposure (50/50) with unacceptable drawdowns, or minimal Bitcoin exposure (5/95) that sacrifices upside. Dynamic volatility-based allocation escapes this binary choice.
- The Behavioral Challenge: Bitcoin's volatility triggers emotional decision-making. By mechanically adjusting exposure based on volatility rather than price or sentiment, the index removes discretionary decisions during precisely the moments when investor judgment is most compromised.
- The Diversification Opportunity: The low Bitcoin-gold correlation means the two assets provide complementary store of value exposures through different mechanisms, gold through millennia of monetary tradition and central bank acceptance, Bitcoin through cryptographic scarcity and network effects. The index captures both.
6. Conclusion
The debate over Bitcoin's store of value credentials has been hampered by conceptual confusion about what defines this asset category. Critics who point to Bitcoin's volatility and drawdowns as disqualifying factors implicitly hold it to standards that traditional store of value assets like gold and silver demonstrably fail to meet. Gold's 65% peak-to-trough decline lasting two decades, and silver's 90%+ drawdowns across multiple cycles, establish that significant price volatility is characteristic not contradictory of store of value assets.
What truly defines store of value assets are their fundamental attributes: scarcity, lack of central control, and resistance to arbitrary supply expansion. On these dimensions, Bitcoin represents an evolutionary advance over precious metals. Its mathematically enforced supply cap of 21 million units, cryptographic verification replacing physical assay, instant global portability, and seizure resistance through seed phrase memorization address historical limitations of commodity-based stores of value. Bitcoin isn't attempting to replace gold; it's extending the store of value category into the digital realm while maintaining the core attributes that made gold valuable for millennia.
The near-zero correlation between Bitcoin and gold creates compelling portfolio construction opportunities. With gold-silver correlation averaging 0.637, holding both precious metals provides limited incremental diversification. In contrast, the Bitcoin-gold correlation of 0.058 offers genuinely complementary exposures to monetary debasement risk through uncorrelated return streams—gold through traditional safe-haven dynamics, Bitcoin through technological adoption and liquidity-driven appreciation.
The Coinbase Store of Value Index demonstrates how investors can practically implement these insights. Through inverse volatility weighting and quarterly rebalancing, the strategy achieves 30% CAGR with a maximum drawdown of only -29% -just 7 percentage points worse than gold alone, while delivering double the return. The 1.26 Sharpe ratio and 1.89 Sortino ratio exceed all static allocation alternatives, validating the approach across both total and downside risk metrics.
As we enter an era of heightened fiscal stress, elevated debt levels, and potential currency debasement, the case for combining gold and Bitcoin in store of value allocations strengthens. The two assets offer complementary protection mechanisms: gold through established acceptance among central banks and institutional investors, Bitcoin through programmatic scarcity and network-based verification. The Coinbase Store of Value Index provides a disciplined framework for capturing both, systematically rebalancing between the legacy monetary metal and its digital successor based on market conditions rather than emotion or speculation.
The question is no longer whether Bitcoin qualifies as a store of value -its fundamental attributes establish that it does. The question is whether investors will recognize this reality before the next phase of monetary disorder makes it obvious to everyone.
IMPORTANT DEFINITIONS AND DISCLOSURES
Copyright © 2025 by MarketVector Indexes GmbH (‘MarketVector’) All rights reserved. The MarketVector family of indexes (MarketVectorTM, Bluestar®, MVIS®) is protected through various intellectual property rights and unfair competition and misappropriation laws. MVIS® is a registered trademark of Van Eck Associates Corporation that has been licensed to MarketVector. MarketVectorTM and MarketVector IndexesTM are pending trademarks of Van Eck Associates Corporation. BlueStar®, BlueStar Indexes®, BIGI®, and BIGITech® are trademarks of MarketVector Indexes GmbH.
Redistribution, reproduction, and/or photocopying in whole or in part are prohibited without written permission. All information provided by MarketVector is impersonal and not tailored to the needs of any person, entity, or group of persons. MarketVector receives compensation in connection with licensing its indexes to third parties. You require a license from MarketVector to launch any product that is linked to a MarketVectorTM Index to use the index data for any business purpose and all use of the MarketVectorTM name or name of the MarketVectorTM Index. The past performance of an index is not a guarantee of future results.
It is not possible to invest directly in an index. Exposure to an asset class represented by an index is available through investable instruments based on that index. MarketVector does not sponsor, endorse, sell, promote, or manage any investment fund or other investment vehicle that is offered by third parties and that seeks to provide an investment return based on the performance of any index. MarketVector makes no assurance that investment products based on the index will accurately track index performance or provide positive investment returns. MarketVector is not an investment advisor, and it makes no representation regarding the advisability of investing in any such investment fund or other investment vehicle. A decision to invest in any such investment fund or other investment vehicle should not be made in reliance on any of the statements set forth in this document.
Investments into cryptocurrencies and/or digital assets are subject to material and high risk including the risk of total loss. The calculated prices may not be achieved by investors as the calculated price is based on prices from different trading platforms. Furthermore, an investment into cryptocurrencies and/or digital assets may become illiquid depending on the trading platform or investment product used for the specific investment. Investors should carefully review all risk factors disclosed by the relevant trading platform or in the product documents of relevant investment products.
Prospective investors are advised to make an investment in any such fund or other vehicle only after carefully considering the risks associated with investing in such funds, as detailed in an offering memorandum or similar document that is prepared by or on behalf of the issuer of the investment fund or other vehicle. The inclusion of a security within an index is not a recommendation by MarketVector to buy, sell, or hold such security, nor is it considered to be investment advice.
All information shown prior to the index launch date is simulated performance data created from backtesting ("Simulated past performance”). Simulated past performance is not actual but hypothetical performance based on the same or fundamentally the same methodology that was in effect when the index was launched. Simulated past performance may materially differ from the actual performance. Actual or simulated past performance is no guarantee for future results.
These materials have been prepared solely for informational purposes based upon information generally available to the public from sources believed to be reliable. No content contained in these materials (including index data, ratings, credit-related analyses and data, model, software, or other application or output therefrom) or any part thereof (Content) may be modified, reverse-engineered, reproduced or distributed in any form by any means, or stored in a database or retrieval system, without the prior written permission of MarketVector. The Content shall not be used for any unlawful or unauthorized purposes. MarketVector and its third-party data providers and licensors (collectively “MarketVector Parties”) do not guarantee the accuracy, completeness, timeliness, or availability of the Content. MarketVector Parties are not responsible for any errors or omissions, regardless of the cause, for the results obtained from the use of the Content. THE CONTENT IS PROVIDED ON AN “AS IS” BASIS. MARKETVECTOR PARTIES DISCLAIM ANY AND ALL EXPRESS OR IMPLIED WARRANTIES, INCLUDING, BUT NOT LIMITED TO, ANY WARRANTIES OF MERCHANTABILITY OR FITNESS FOR A PARTICULAR PURPOSE OR USE, FREEDOM FROM BUGS, SOFTWARE ERRORS, OR DEFECTS, THAT THE CONTENT’S FUNCTIONING WILL BE UNINTERRUPTED OR THAT THE CONTENT WILL OPERATE WITH ANY SOFTWARE OR HARDWARE CONFIGURATION. In no event shall MarketVector Parties be liable to any party for any direct, indirect, incidental, exemplary, compensatory, punitive, special, or consequential damages, costs, expenses, legal fees, or losses (including, without limitation, lost income or lost profits and opportunity costs) in connection with any use of the Content even if advised of the possibility of such damages.
About the Author(s):
Martin Leinweber leads digital asset research and strategy at MarketVector Indexes, where he develops index products, publishes institutional research, and serves as the firm's primary voice on crypto markets to a global client base. His work sits at the intersection of systematic investing and an emerging asset class, translating rigorous quantitative frameworks into actionable insight for institutional investors. Before joining MarketVector, Martin spent nearly two decades as a Portfolio Manager across equities, fixed income, and alternative investments. At Quoniam Asset Management, one of Germany's foremost quantitative houses, he managed active funds for institutional clients including insurance companies, pension funds, and sovereign wealth funds. Earlier in his career at MEAG, the asset manager of Munich Re and ERGO, he contributed to the firm's international expansion, including the establishment of a joint venture with PICC, China's largest insurance company, with operations in Shanghai and Beijing. Martin is co-author of two Wiley publications: Asset-Allokation mit Kryptoassets: Das Handbuch (2021), the first institutional handbook on integrating digital assets into traditional portfolios, and Mastering Crypto Assets: Investing in Bitcoin, Ethereum, and Beyond (2024). He holds a Master of Economics from the University of Hohenheim and is a CFA Charterholder.
Jonas Weber is an emerging expert in digital assets and investment strategies. As a Digital Asset Analyst at MarketVector, he excels in generating innovative index ideas, building out the quantitative research infrastructure, conducting in-depth research, and supporting client communications. Before joining MarketVector, Jonas honed his skills as a working student in Investment Consulting. At Lurse AG, a pension consultancy firm, he was instrumental in developing new investment strategies and analyzing the risk and performance of model portfolios. His collaboration with Lurse AG also extended to his master’s thesis, which he completed summa cum laude, focusing on various investment strategies and deriving optimal guarantee levels.
Get the latest news & insights from MarketVector
Get the newsletterRelated:
Most popular
-
 Commentary
Goal! Small Country, Big Impact
-
 Commentary
Hidden GEMs: Ukraine