
In a period marked by geopolitical fragmentation and fiscal expansion, strategic commodities have taken on renewed macro relevance. Gold, uranium, and strategic metals increasingly reflect monetary dynamics, energy policy, and industrial security considerations.
Across MarketVector’s ecosystem, Global Gold Miners (MVGDX, MVGDXJ), Uranium & Nuclear Energy (MVNUCL, MVNLR, MVNLRX), and Rare Earth & Strategic Metals (MVREMX) collectively form what we refer to as the Commodity Core [1], a rules-based cluster of commodity-equity exposures linked to monetary dynamics, energy security, and strategic resource policy.
To formalize this framework, we decompose the current inflation regime into three structural transmission channels.
Table 1. Fragmented Inflation Channels and Thematic Hedges
Inflation today is multi-channel, driven by monetary, energy, and strategic policy forces.
Channel |
Driver |
Thematic Hedge |
MarketVector Index |
Monetary |
Currency debasement / real-yield compression |
Gold & Silver Miners |
MVGDX, MVGDXJ |
Energy / Supply |
Electrification / nuclear baseload |
Uranium & Nuclear Energy |
MVNUCL, MVNLR, MVNLRX |
Strategic / Policy |
Export controls, defense capex, reshoring |
Rare Earth & Strategic Metals |
MVREMX |
Each channel corresponds to a distinct thematic hedge, together forming a diversified Commodity Core allocation across monetary, energy, and strategic-policy risks.
Policy Catalysts and Market Drivers
These policy-linked sectors reflect a shifting macro backdrop in which fiscal incentives and resource security considerations increasingly shape commodity cycles.
- Gold & Silver Miners (MVGDX / MVGDXJ): Benefit from debt monetization and real-yield volatility. MVGDXJ adds operating leverage and geographic diversification.
- Uranium & Nuclear (MVNLR / MVNUCL / MVNLRX): Supported by the U.S. Inflation Reduction Act [2], the EU nuclear taxonomy inclusion [3], and expanding reactor fleets across Asia, reinforcing nuclear power as a strategic baseload energy source.
- Rare Earth & Strategic Metals (MVREMX): Capture the strategic scarcity premium emerging as supply chains fragment under export restrictions and critical-mineral policies.
Beyond thematic alignment, performance data illustrate how these exposures have behaved in practice.
Figure 1. Commodity Core Performance vs. Broad Market (Rebased to 100)
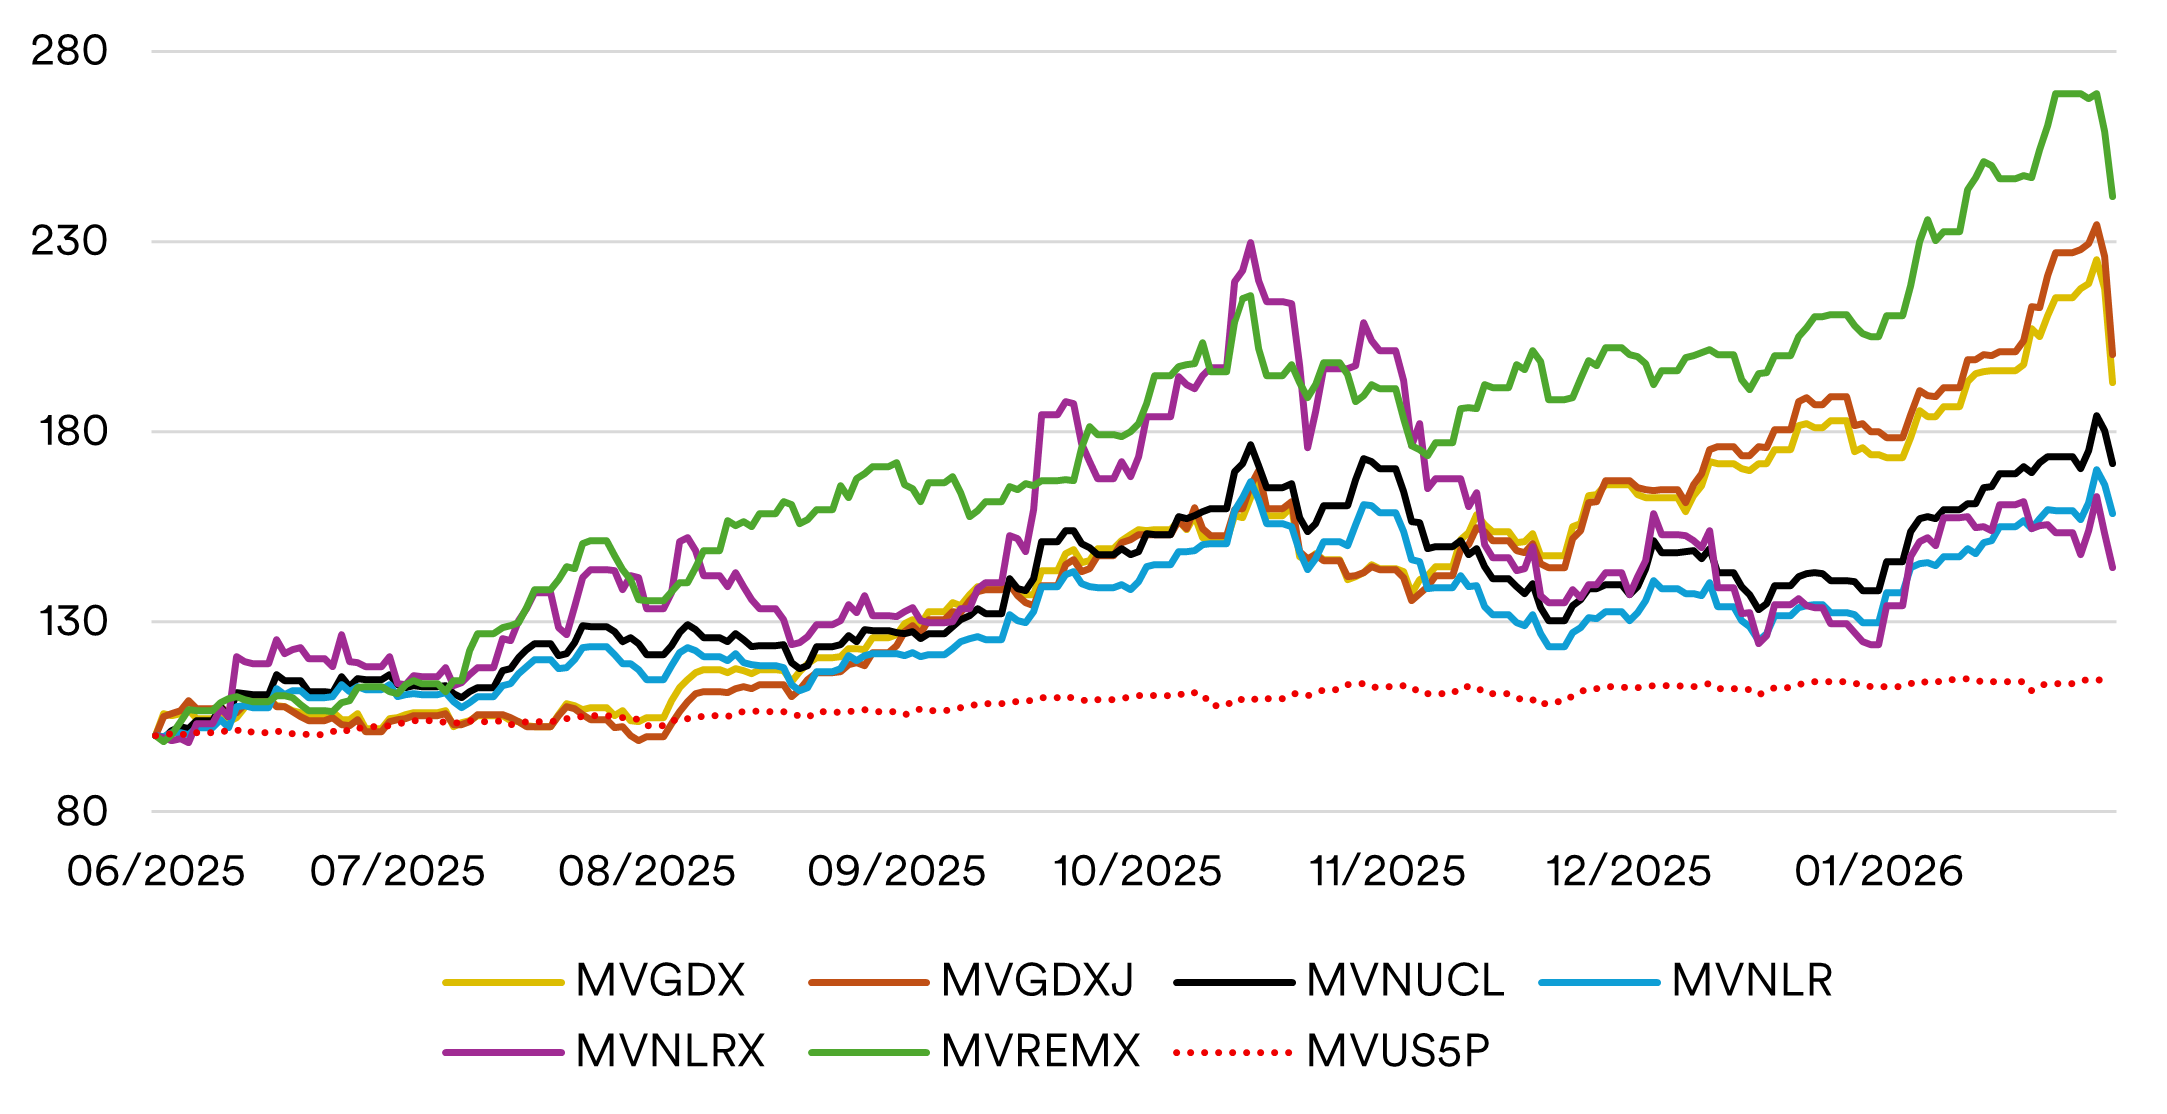
Since June 2025, the Commodity Core indexes have outperformed the broader market over the observed period. Source: MarketVector™ Indexes, Index Values from June 1, 2025 – January 30, 2026, rebased to 100 (June 1, 2025).
Empirical Evidence: Cross-Index Diversification
The following correlation matrix highlights distinct thematic clustering alongside moderate linkage to broader equity markets, represented here by the MarketVector™ Top 500 US Profitable Companies Index (MVUS5P) [4].
Figure 2. Cross-Index Correlation Matrix (Daily Log Returns)
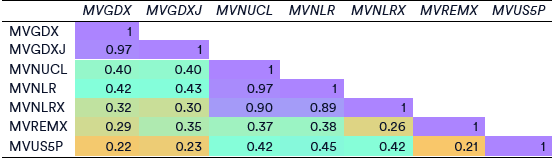
Correlation Heatmap: Orange = lower linkage; Turquoise = moderate linkage; Purple = strong correlation.
Source: MarketVector™ Indexes daily log returns from June 2025 – February 2026.
Gold miners move nearly in lockstep (ρ ≈ 0.97), while uranium and nuclear equities form a tightly integrated cluster (ρ ≈ 0.89–0.97). Rare earths exhibit lower correlations (ρ ≈ 0.26–0.38), reinforcing differentiated industrial-policy exposure.
Correlations versus the broad U.S. market remain moderate (ρ ≈ 0.21–0.45), indicating that while equity-based, return drivers are not fully synchronized with traditional risk assets. This diversification profile is further reinforced by the indexes’ multi-currency composition.
Currency Diversification: Embedded FX Exposure
Beyond thematic exposure, the Commodity Core spans 14 distinct trading currencies across developed and emerging markets, reflecting its global listing structure.
Gold-focused indexes are primarily exposed to CAD, AUD, GBP and USD listings, while uranium strategies broaden the footprint to EUR, JPY and KRW. Rare earth exposures further introduce CNH, HKD and selected emerging market currencies.
Daily FX correlations (June 2025 – February 2026) show clustering within European currencies (EUR–CZK–GBP) and moderate linkage among commodity-sensitive currencies such as AUD and CAD, while emerging market currencies display more differentiated behavior.
As FX returns are expressed versus USD, the U.S. dollar is excluded from the correlation matrix as the base currency. While not a direct hedge, the multi-currency footprint reduces single-currency concentration and adds structural diversification.
Figure 3. FX Correlation Matrix (USD Base)
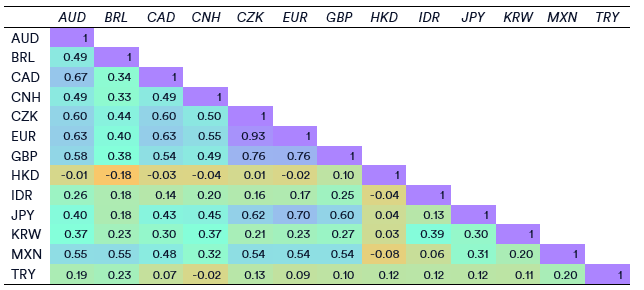
FX Correlation Heatmap: Orange = lower linkage; Turquoise = moderate linkage; Purple = strong correlation.
Source: MarketVector™ Indexes daily spot FX closes and calculated log returns, June 2025 – February 2026.
While diversification strengthens the allocation case, structural exposure ultimately depends not only on thematic selection but also on index construction discipline.
Granular Index Exposure and Methodological Innovation
MarketVector’s revenue-based methodology links macro themes to measurable fundamentals, ensuring performance aligns with genuine thematic revenue exposure rather than incidental classification effects.
Table 2. Summary of the Granular Revenue Exposure by Index Group
INDEX GROUP |
AGGREGATED COMMODITY EXPOSURE |
METHODOLOGY HIGHLIGHT |
INDEX EXPOSURE |
Gold Miners (MVGDX / MVGDXJ) |
82% Gold Mining · 8% Silver Mining · 1% Copper Mining · 10% Non-thematic |
Weighting Large/ small weights 20%, 4.5%; 7% cap |
Balanced liquidity and operational leverage to bullion. |
Uranium & Nuclear (MVNUCL / MVNLR / MVNLRX) |
24% Uranium Mining · 10% Nuclear Power Generation · 9% Small Nuclear Reactors · diversified fuel-cycle segments · 33% Non-thematic |
Weighting 15%/ 8%/ 30% cap |
Captures the full nuclear ecosystem from mine to reactor. |
Rare Earth & Strategic Metals (MVREMX) |
28% Lithium · 11% Titanium · 8% Spodumene (Lithium) · 8% Rare Earths · diversified strategic metals · 12% Non-thematic |
Weighting 8% cap Thematic revenue screen ≥50% revenue from combination of rare earth/strategic metals |
Tracks critical materials central to industrial and energy transition policy. |
Source: MarketVector™ Indexes, Data as of 2025 Q4 Index Review
MarketVector’s pure-play, revenue-based methodology requires at least 50% of revenues from core thematic activities (with a lower threshold for current constituents), ensuring exposure reflects underlying economic activity rather than incidental sector sensitivity or classification.
The following clustered bar figures illustrate the constituent-level aggregate revenue exposure by index group, aggregating primary thematic subthemes (main revenue source) and secondary thematic subthemes.
Non-thematic exposure represents constituent the aggregated revenues that cannot be classified within either defined thematic subthemes.
Figure 4. Clustered Bars – Aggregated Thematic Revenue Exposure
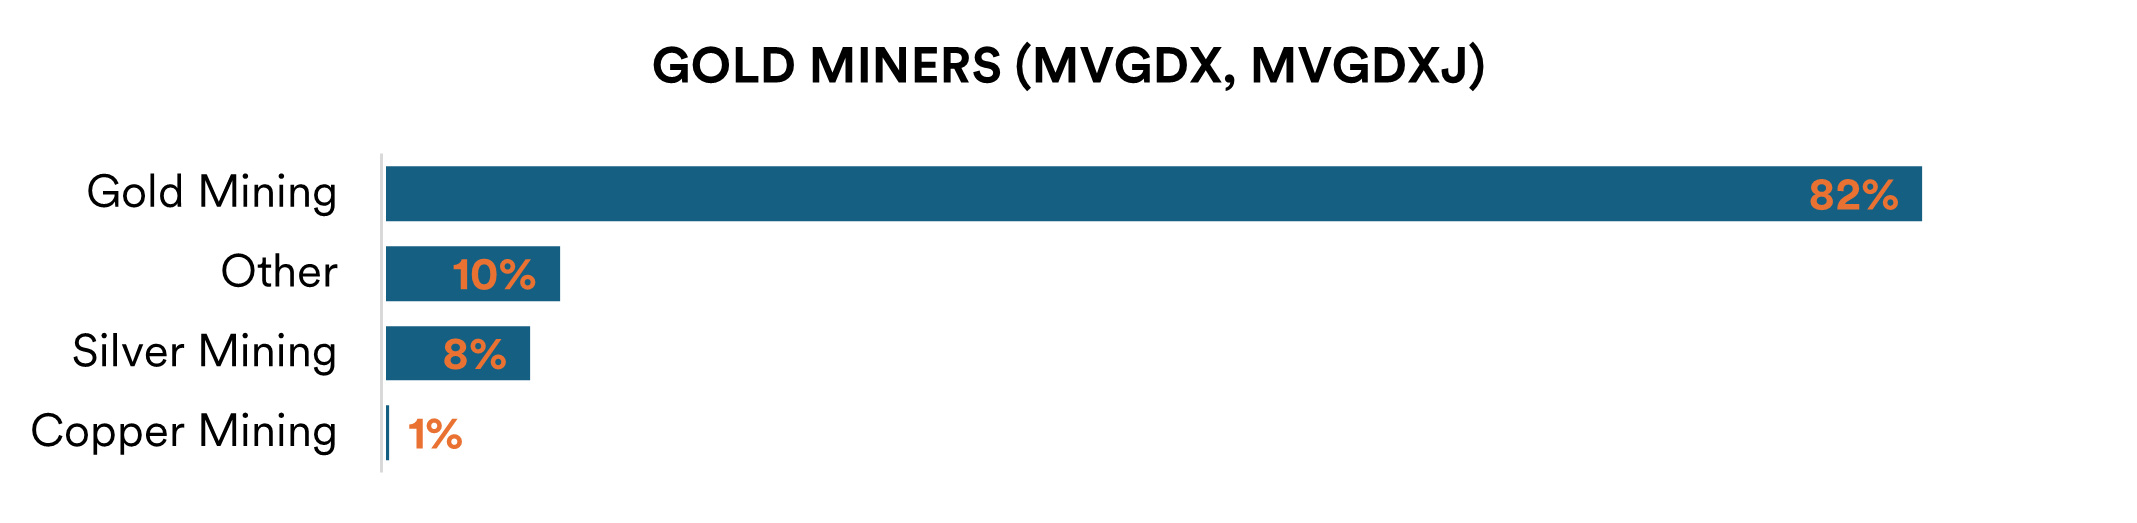
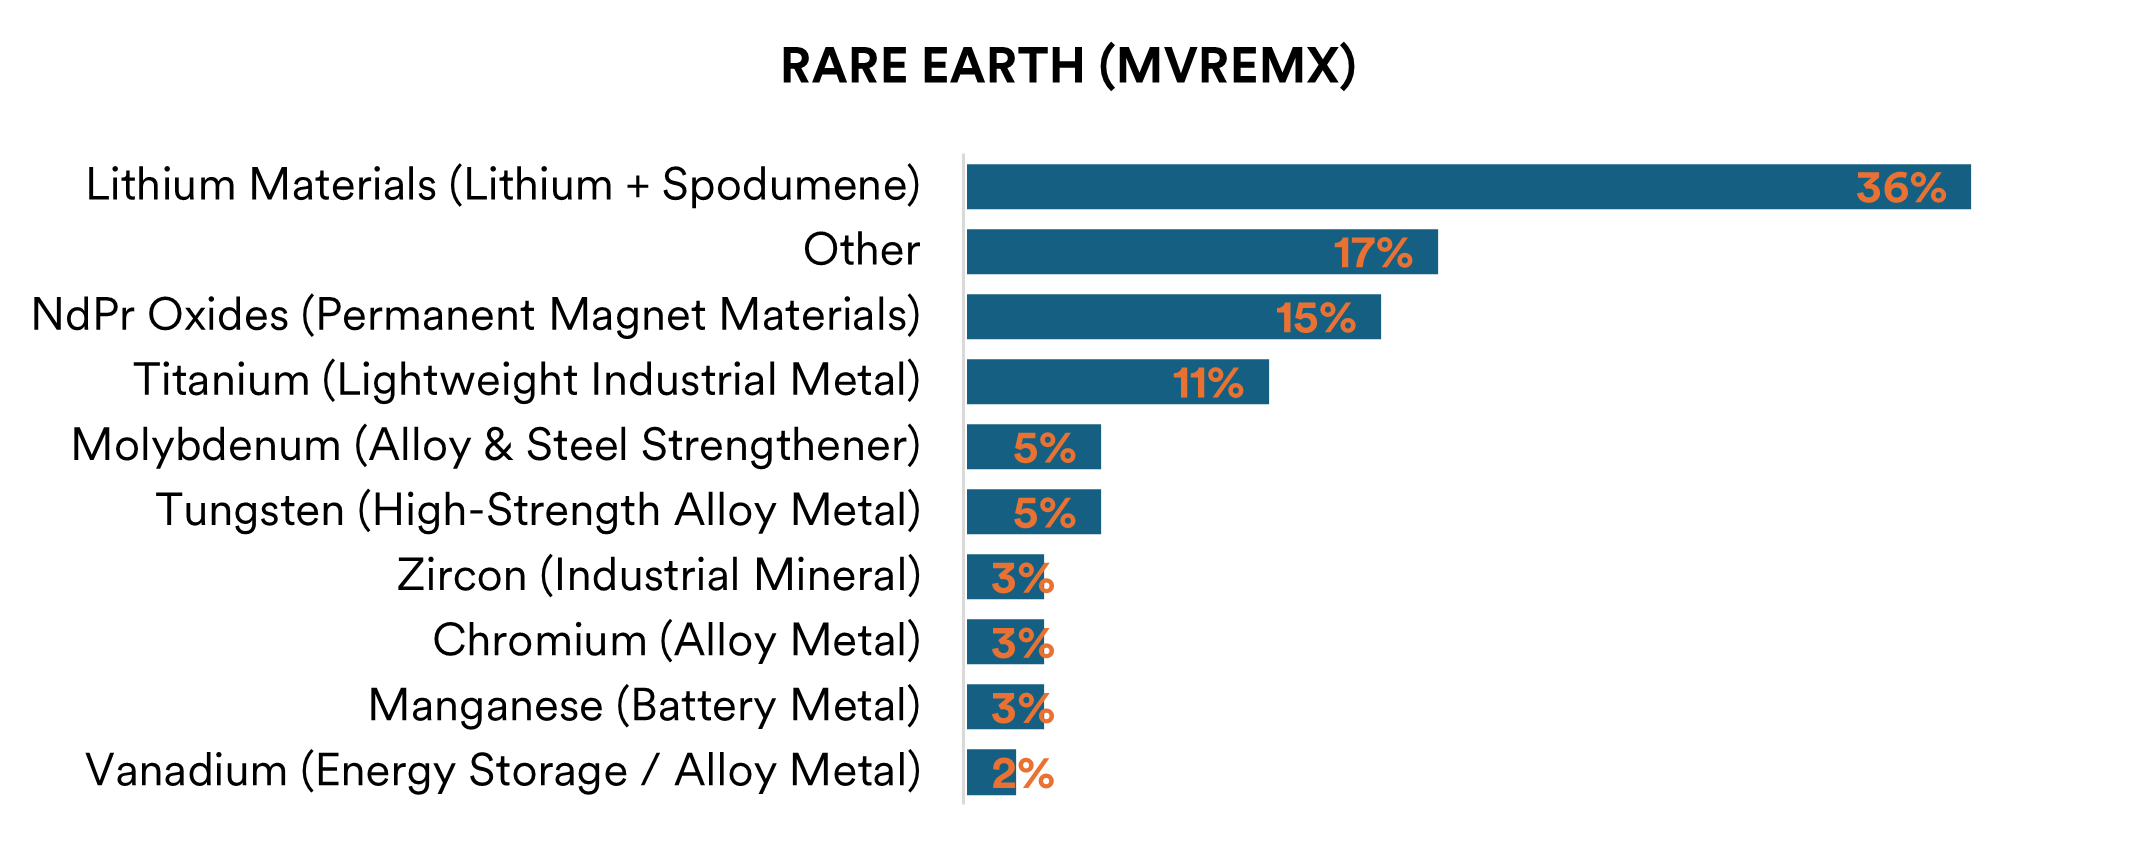
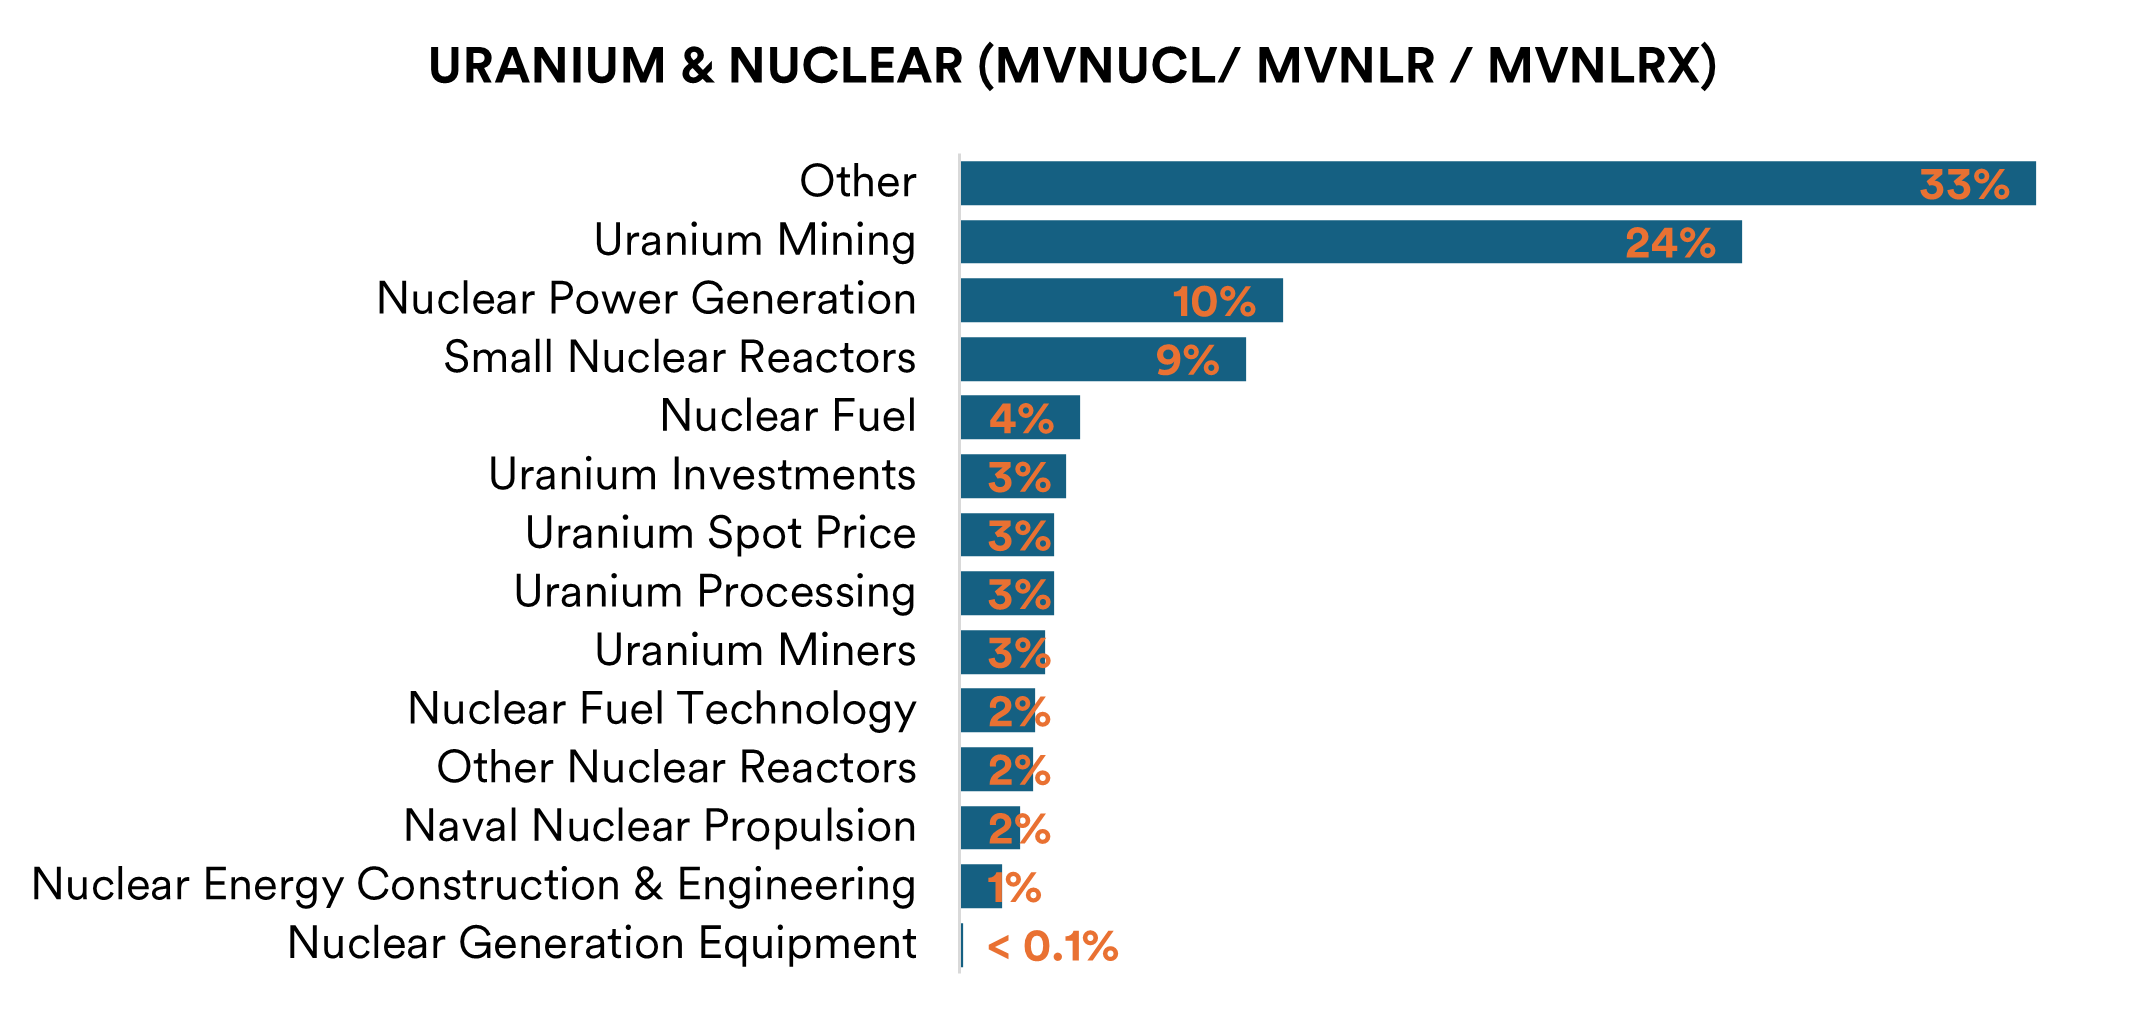
Source: MarketVector™ Indexes, Data as of 2025 Q4 Index Review.
“Other” represents the aggregated revenues that cannot be classified within either defined thematic subthemes.
Strategic Outlook
The Commodity Core represents a structural allocation to evolving monetary regimes, energy transition dynamics, and strategic resource policy. Gold anchors portfolios to real-yield sensitivity; uranium underwrites clean-energy baseload; rare earths monetize supply-chain sovereignty.
In a polarized global economy, MarketVector’s rules-based index design provides systematic access to the resource-driven macro forces shaping the next investment cycle.
Sources:
MarketVector™ Global Gold Miners (MVGDX)
MVIS® Global Junior Gold Miners (MVGDXJ)
MarketVector™ Gl. Uranium and Nuclear Energy Infrastructure (MVNUCL)
MVIS® Global Uranium & Nuclear Energy (MVNLR)
MVIS® Global Rare Earth/Strategic Metals (MVNLRX)
MarketVector™ Global Nuclear Innovators Index (MVREMX)
[2] H.R.5376 – Inflation Reduction Act of 2022 (text on Congress.gov)
[3] EU taxonomy: Complementary Climate Delegated Act to accelerate decarbonisation
[4] MarketVector™ Top 500 US Profitable Companies Index (MVUS5P)
For informational and advertising purposes only. The views and opinions expressed are those of the authors but not necessarily those of MarketVector Indexes GmbH. Opinions are current as of the publication date and are subject to change with market conditions. Certain statements contained herein may constitute projections, forecasts, and other forward-looking statements that do not reflect actual results. It is not possible to invest directly in an index. Exposure to an asset class represented by an index is available through investable instruments based on that index. MarketVector Indexes GmbH does not sponsor, endorse, sell, promote, or manage any investment fund or other investment vehicle that is offered by third parties and that seeks to provide an investment return based on the performance of any index. The inclusion of a security within an index is not a recommendation by MarketVector Indexes GmbH to buy, sell, or hold such security, nor is it considered to be investment advice.
About the Author(s):
Antonio Fons Palomares is a Senior Index Research Analyst at MarketVector Indexes™ (“MarketVector”). His core responsibilities include index research, design, and development across all asset classes. Antonio is a CAIA Charterholder and a Doctoral Researcher in Quantitative Finance at the International University of Andalusia (UNIA), Spain, where his research focuses on Time Series analysis. He holds a Master of Science in Financial Engineering from the University of Poitiers, France, and a Bachelor’s degree in Economics and Business Administration from the University of Paris-Saclay, France.
Get the latest news & insights from MarketVector
Get the newsletterRelated:
Most popular
-
 Commentary
Goal! Small Country, Big Impact
-
 Commentary
Hidden GEMs: Ukraine