
Key Takeaways
- Bitcoin is 269 days into its fourth major bear market, down 54% from the October 2025 top of $124,724. The three prior cycles all printed their final low between day 364 and day 406, placing the historical low window in October–November 2026.
- Each cycle, the final low has undercut the first capitulation low by less: −40% (2014), −46% (2018), −12% (2022). Within the current bear, successive lows are converging even faster: $80.6K → $60.1K (−25%) → $57.7K (−4%).
- July 1 delivered a textbook key reversal: price swept the prior low to $57,749, then closed back above it on 81st-percentile volume. Buyer absorption has jumped from 13% of volume on up-days at the June washout to 46% today, a bullish divergence into a marginal new price low.
- The MarketVector Crypto Heat Index printed 0.011 in December 2025, the deepest reading on record, and at 0.15 has slipped back into capitulation territory. Three accumulation signals are open, the same trough-clustering that marked the 2018 and 2022 bottoms.
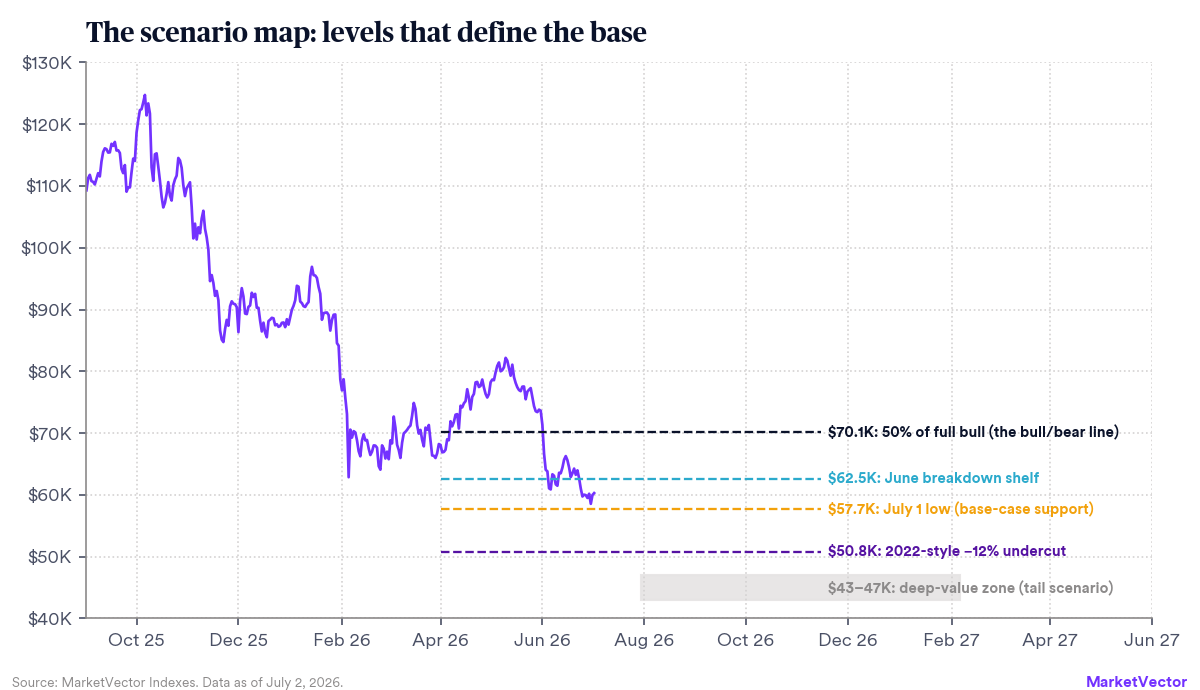
- Our base case: a multi-month base between roughly $58K and $70K, with a possible final flush toward $50–51K (a 2022-style undercut). A daily reclaim of $70.1K, the 50% retracement of the full bull cycle, would confirm the bear phase is over.
Four bears, one pattern
Every Bitcoin bear market has been fought under different fundamentals: a collapsing offshore exchange in 2014, an ICO hangover in 2018, a leverage unwind in 2022, and today a post-ETF distribution cycle. Yet the price structure keeps rhyming. Overlaying the four drawdowns from their respective cycle tops shows the current decline tracking the historical template closely, with one notable difference: it is shallower. At day 269, this cycle sits at −54%, versus −59% to −67% at the same point in the three prior bears. Deeper spot liquidity, ETF flows, and corporate treasury demand have visibly dampened the amplitude.
Figure 1: Drawdowns from cycle top, aligned by trading day. Dots mark the final lows of prior cycles.
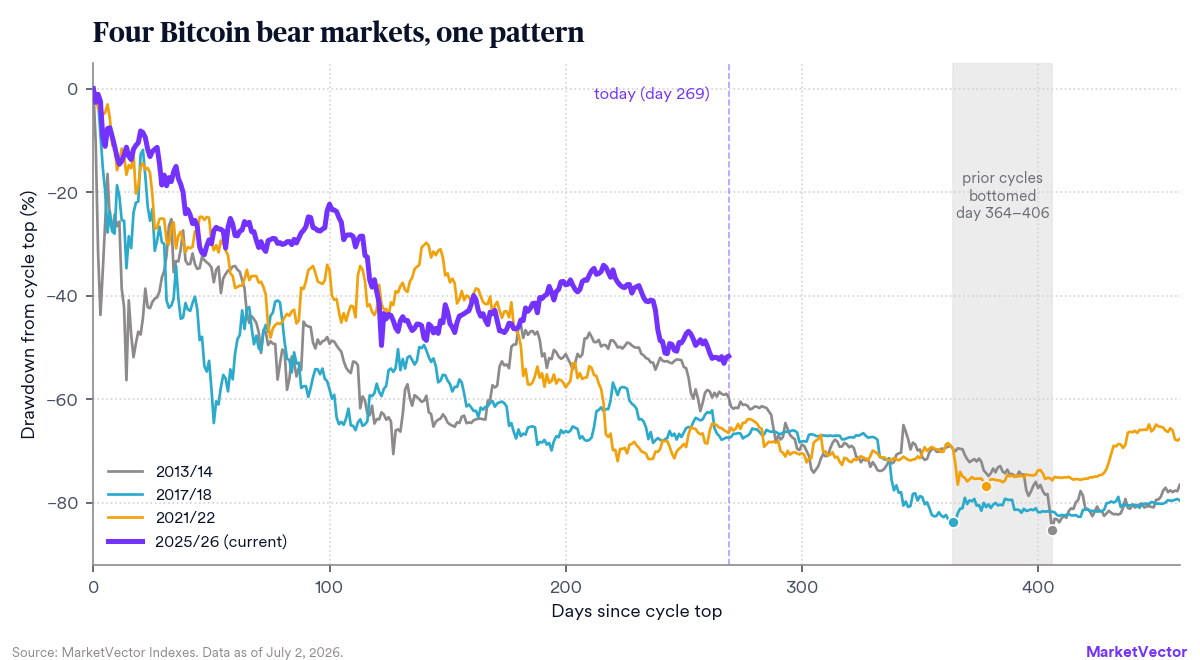
The time dimension matters as much as price. The 2014, 2018, and 2022 bears all found their terminal low between 364 and 406 days after the top. Applied to the October 6, 2025 peak, that window spans early October to mid-November 2026. Our Crypto Heat Index cycle clock (which measures low-to-low periods of 1,431 and 1,437 days across the last two completed cycles, a spread of just six days) points to a nearly identical window in late Q3 to Q4 2026. Two independent clocks, one destination.
The shrinking undercut
The most underappreciated statistic in Bitcoin cycle analysis is what happens between the first capitulation low and the final low. In 2014, the final low undercut the October capitulation by 40%. In 2018, the December low undercut June by 46%. In 2022, the November low undercut June by just 12%. The market is maturing: each cycle, the terminal flush gets smaller as the marginal seller base thins out earlier.
Figure 2: Left: final-low undercut by cycle. Right: the current bear’s major lows are converging.
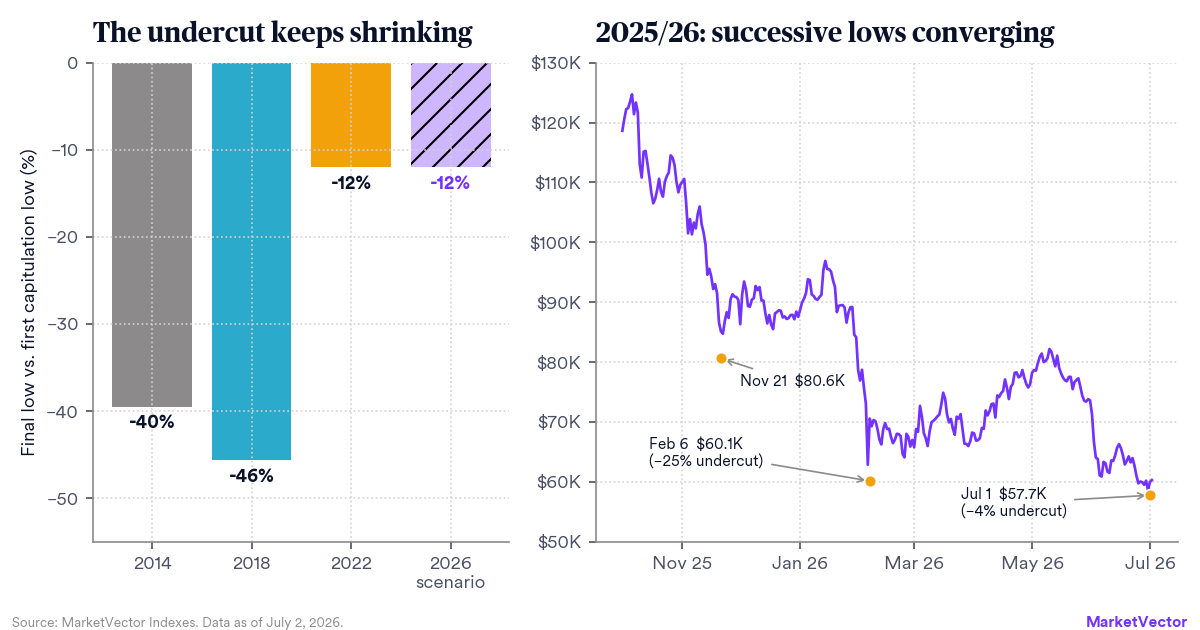
The current cycle is extending the pattern within itself. The November 2025 low at $80.6K was undercut by 25% at the February low of $60.1K; the July 1 low of $57.7K undercut February by just 4%. Sellers are running out of ammunition at progressively higher relative levels. If the final low mirrors the 2022 template (a 12% undercut of the standing low), it lands near $50,800. If the market has matured further still, $57.7K may already be within a few percent of the terminal print.
The tape is turning: absorption and the July 1 reversal
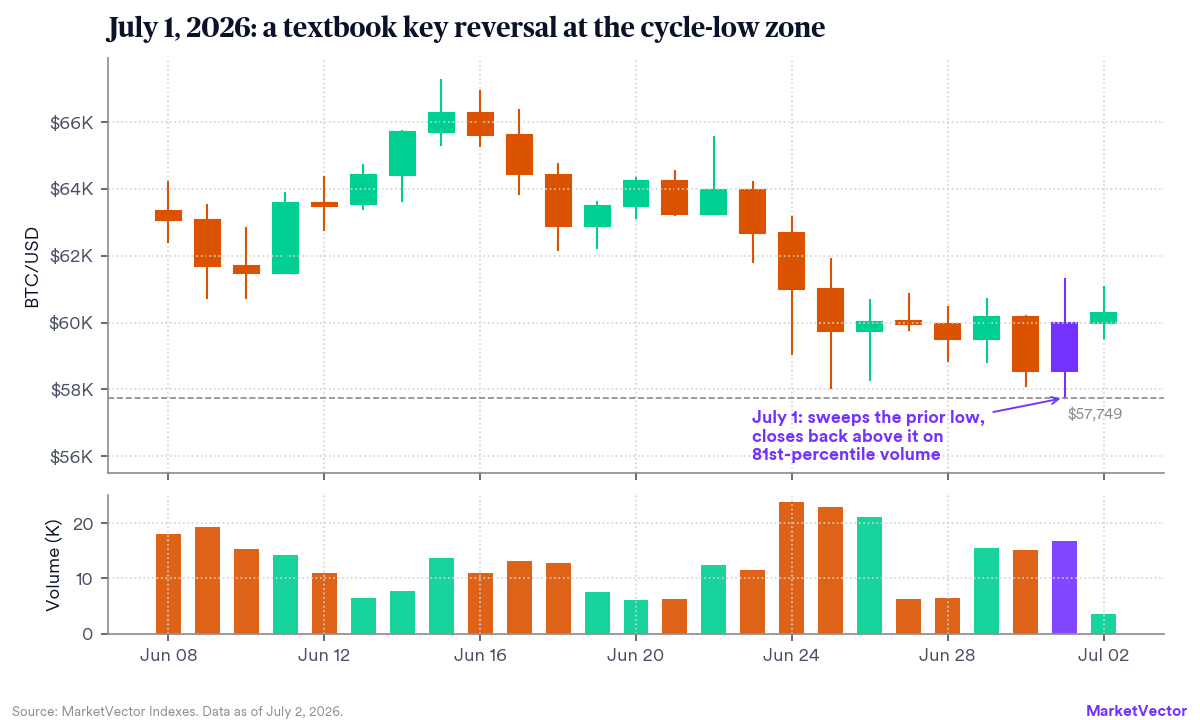
Base building is ultimately a statement about volume: someone has to absorb the remaining supply. Two pieces of tape evidence suggest that absorption is underway. First, July 1 printed a classic key reversal: price swept below the prior day’s low to $57,749, then closed back above it at $59,983 on volume in the 81st percentile of the previous 90 days. Stop-loss liquidity below an obvious low was taken, and buyers paid up for all of it.
Figure 3: Daily candles, June 8 - July 2, 2026. The July 1 session (purple) swept and reclaimed the low.
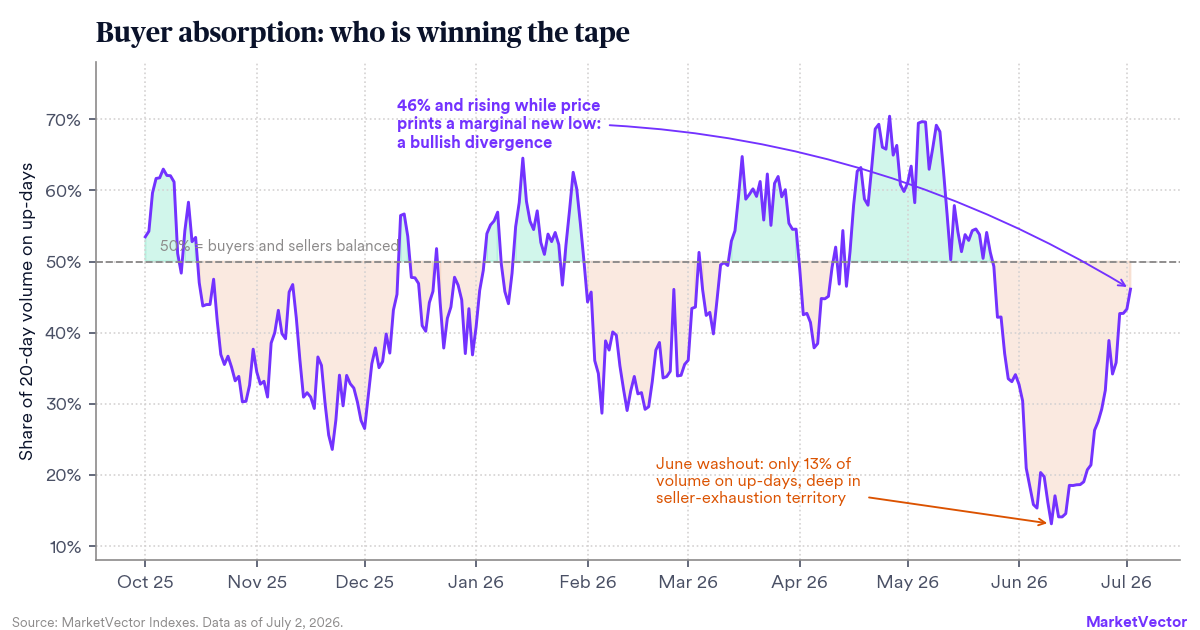
Second, the balance of volume has shifted violently. At the June washout, only 13% of rolling 20-day volume traded on up-days, a seller-dominance extreme rarely seen outside terminal capitulations. Since then the ratio has recovered to 46% and is still rising, even as price printed a marginal new low. Buyers are winning a growing share of the tape at falling prices. This is the same footprint that preceded the definitive turns in 2018 and 2022: volume improving while price flatlines or makes marginal new lows.
Figure 4: Share of 20-day volume occurring on up-days. Readings below ~20% mark seller exhaustion.
Sentiment: the Heat Index already called capitulation, twice
Price-based sentiment tells the same story from a different angle. The MarketVector Crypto Heat Index, our participation-based sentiment gauge across the top 100 tokens, printed 0.011 on December 18, 2025: the deepest cycle-low reading on record, an order of magnitude below the readings at the 2018 (~0.08) and 2022 (~0.19) bear-market lows. As of June 30 the index stands at 0.15, back below the 25% capitulation threshold for the second time this cycle. Prior bottoms were built exactly this way: not one washout, but a sequence of them at successively less fearful extremes.
Figure 5: MarketVector Crypto Heat Index since 2015, with model BUY/SELL signals and sentiment zones.
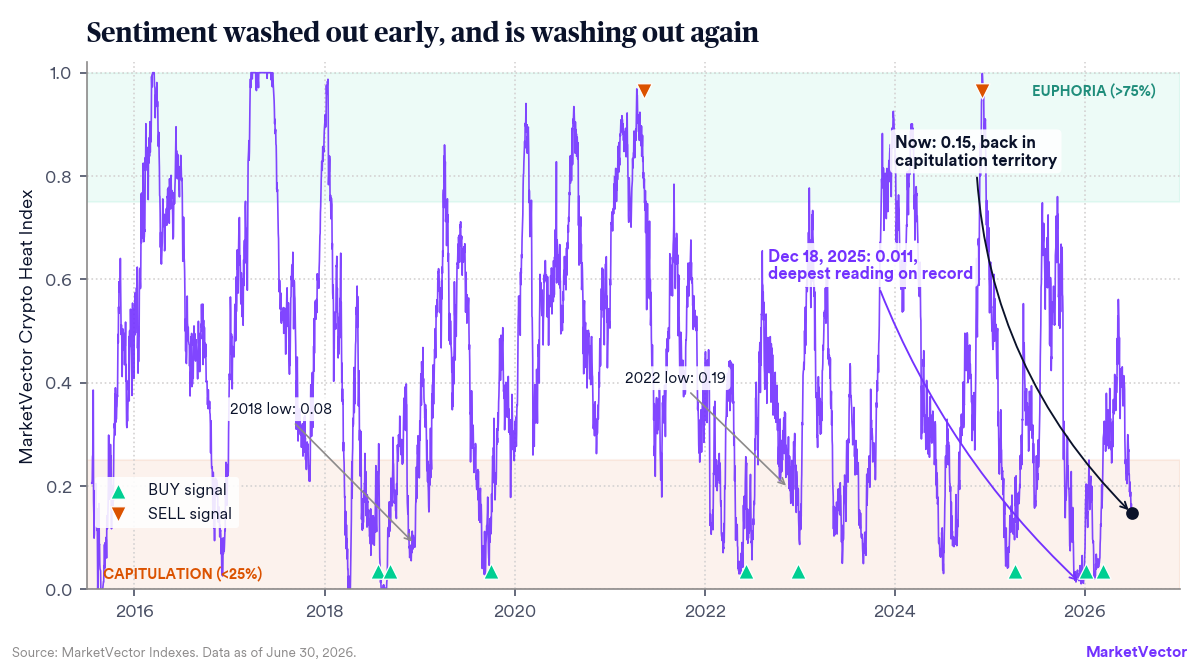
The signal record reinforces the message. Three accumulation (BUY) signals are currently open (April 2025, January 2026, and March 2026), the same trough-clustering that marked prior cycle bottoms: two signals fired in mid-2018 ahead of the December low, and the June and December 2022 signals bracketed the November 2022 bottom almost symmetrically. Historically, these signals reward patience rather than precision: across the full distribution of comparable low-sentiment entry points, Bitcoin has traded above the signal price 78.5% of the time one year later and 95.9% of the time two years later. Open signals routinely endure double-digit drawdowns before resolving higher, which is precisely the phase we are in now.
The scenario map
We frame the coming two quarters around five levels, each with a defined role and a defined invalidation.
Figure 6: The levels that define the base. The 50% retracement of the full bull cycle sits at $70.1K.
Level |
Role |
Interpretation |
|---|---|---|
$70.1K |
Resistance |
The 50% retracement of the entire 2022–2025 bull cycle ($15.5K to $124.7K). Reclaiming and holding this level would signal the bear phase is over. Until then, rallies into this zone are counter-trend. |
$62.5K |
Resistance |
The late-June breakdown shelf. The first test of any recovery attempt; acceptance above it targets the $70K decision zone. |
$57.7K |
Support |
The July 1 sweep low, defended on 81st-percentile volume. Base-case support: as long as daily closes hold above this zone, the base-building thesis is intact. |
$50.8K |
Support |
A 2022-style −12% undercut of the current low. If the final flush mirrors the last cycle, this is where it lands. Historically the zone of maximum opportunity. |
$43–47K |
Tail zone |
Deep-value territory reached only under a 2014/2018-style −40% undercut or an exogenous shock. We view this as a low-probability tail, given market maturity. |
Base case (highest probability). Bitcoin builds a multi-month base between roughly $58K and $70K through Q3, with rallies stalling first at $62.5K and then at the $70–71K decision zone, mirroring the July–October consolidations of 2018 and 2022. A final flush toward $50–51K within the October–November window would complete the historical template. Position building on weakness below $60K is consistent with this view.
Constructive case. The July 1 low was the terminal print. Confirmation would come from a daily close reclaiming $70.1K on expanding breadth and up-volume, in which case the bear phase ended 100+ days earlier than any prior cycle. That is plausible given the shallower drawdown, but not yet supported by the clock.
Bear case. A decisive loss of $57.7K on rising down-volume (the opposite of the July 1 footprint) opens the $50.8K undercut target directly, and a 2014/2018-style repricing toward $43–47K cannot be excluded under an exogenous macro shock. This scenario requires the absorption evidence above to reverse, which is observable in real time.
What we are watching
Three things over the next several weeks: whether the up-day volume share can hold above 50% for the first time since May; how price behaves on the first test of $62.5K; and whether any retest of the $57.7K low occurs on lighter volume than July 1, the classic successful-retest signature. The foundation of a bull market is not a price event but a process, and the process has visibly begun.
About the Author(s):
Martin Leinweber leads digital asset research and strategy at MarketVector Indexes, where he develops index products, publishes institutional research, and serves as the firm's primary voice on crypto markets to a global client base. His work sits at the intersection of systematic investing and an emerging asset class, translating rigorous quantitative frameworks into actionable insight for institutional investors. Before joining MarketVector, Martin spent nearly two decades as a Portfolio Manager across equities, fixed income, and alternative investments. At Quoniam Asset Management, one of Germany's foremost quantitative houses, he managed active funds for institutional clients including insurance companies, pension funds, and sovereign wealth funds. Earlier in his career at MEAG, the asset manager of Munich Re and ERGO, he contributed to the firm's international expansion, including the establishment of a joint venture with PICC, China's largest insurance company, with operations in Shanghai and Beijing. Martin is co-author of two Wiley publications: Asset-Allokation mit Kryptoassets: Das Handbuch (2021), the first institutional handbook on integrating digital assets into traditional portfolios, and Mastering Crypto Assets: Investing in Bitcoin, Ethereum, and Beyond (2024). He holds a Master of Economics from the University of Hohenheim and is a CFA Charterholder.
IMPORTANT DEFINITIONS AND DISCLOSURES
Copyright © 2026 by MarketVector Indexes GmbH (‘MarketVector’) All rights reserved. The MarketVector family of indexes (MarketVectorTM, Bluestar®, MVIS®) is protected through various intellectual property rights and unfair competition and misappropriation laws. MVIS® is a registered trademark of Van Eck Associates Corporation that has been licensed to MarketVector. MarketVectorTM and MarketVector IndexesTM are pending trademarks of Van Eck Associates Corporation. BlueStar®, BlueStar Indexes®, BIGI®, and BIGITech® are trademarks of MarketVector Indexes GmbH.
Redistribution, reproduction, and/or photocopying in whole or in part are prohibited without written permission. All information provided by MarketVector is impersonal and not tailored to the needs of any person, entity, or group of persons. MarketVector receives compensation in connection with licensing its indexes to third parties. You require a license from MarketVector to launch any product that is linked to a MarketVectorTM Index to use the index data for any business purpose and all use of the MarketVectorTM name or name of the MarketVectorTM Index. The past performance of an index is not a guarantee of future results.
It is not possible to invest directly in an index. Exposure to an asset class represented by an index is available through investable instruments based on that index. MarketVector does not sponsor, endorse, sell, promote, or manage any investment fund or other investment vehicle that is offered by third parties and that seeks to provide an investment return based on the performance of any index. MarketVector makes no assurance that investment products based on the index will accurately track index performance or provide positive investment returns. MarketVector is not an investment advisor, and it makes no representation regarding the advisability of investing in any such investment fund or other investment vehicle. A decision to invest in any such investment fund or other investment vehicle should not be made in reliance on any of the statements set forth in this document.
Investments into cryptocurrencies and/or digital assets are subject to material and high risk including the risk of total loss. The calculated prices may not be achieved by investors as the calculated price is based on prices from different trading platforms. Furthermore, an investment into cryptocurrencies and/or digital assets may become illiquid depending on the trading platform or investment product used for the specific investment. Investors should carefully review all risk factors disclosed by the relevant trading platform or in the product documents of relevant investment products.
Prospective investors are advised to make an investment in any such fund or other vehicle only after carefully considering the risks associated with investing in such funds, as detailed in an offering memorandum or similar document that is prepared by or on behalf of the issuer of the investment fund or other vehicle. The inclusion of a security within an index is not a recommendation by MarketVector to buy, sell, or hold such security, nor is it considered to be investment advice.
All information shown prior to the index launch date is simulated performance data created from backtesting ("Simulated past performance”). Simulated past performance is not actual but hypothetical performance based on the same or fundamentally the same methodology that was in effect when the index was launched. Simulated past performance may materially differ from the actual performance. Actual or simulated past performance is no guarantee for future results.
These materials have been prepared solely for informational purposes based upon information generally available to the public from sources believed to be reliable. No content contained in these materials (including index data, ratings, credit-related analyses and data, model, software, or other application or output therefrom) or any part thereof (Content) may be modified, reverse-engineered, reproduced or distributed in any form by any means, or stored in a database or retrieval system, without the prior written permission of MarketVector. The Content shall not be used for any unlawful or unauthorized purposes. MarketVector and its third-party data providers and licensors (collectively “MarketVector Parties”) do not guarantee the accuracy, completeness, timeliness, or availability of the Content. MarketVector Parties are not responsible for any errors or omissions, regardless of the cause, for the results obtained from the use of the Content. THE CONTENT IS PROVIDED ON AN “AS IS” BASIS. MARKETVECTOR PARTIES DISCLAIM ANY AND ALL EXPRESS OR IMPLIED WARRANTIES, INCLUDING, BUT NOT LIMITED TO, ANY WARRANTIES OF MERCHANTABILITY OR FITNESS FOR A PARTICULAR PURPOSE OR USE, FREEDOM FROM BUGS, SOFTWARE ERRORS, OR DEFECTS, THAT THE CONTENT’S FUNCTIONING WILL BE UNINTERRUPTED OR THAT THE CONTENT WILL OPERATE WITH ANY SOFTWARE OR HARDWARE CONFIGURATION. In no event shall MarketVector Parties be liable to any party for any direct, indirect, incidental, exemplary, compensatory, punitive, special, or consequential damages, costs, expenses, legal fees, or losses (including, without limitation, lost income or lost profits and opportunity costs) in connection with any use of the Content even if advised of the possibility of such damages.
Get the latest news & insights from MarketVector
Get the newsletterRelated:
Most popular
-
 Commentary
Goal! Small Country, Big Impact
-
 Commentary
Hidden GEMs: Ukraine