
The digital asset market has grown rapidly. One indicator of the rapid growth of this asset class is the number of token in the crypto universe. Another indicator is the development of liquidity. The term liquidity is generally used in the financial markets to describe the ease by which an asset can be converted into cash without difficulty. In terms of cryptocurrencies, liquidity is the ability of a coin to be easily converted into cash or other coins. Liquid markets are deeper and smoother, while an illiquid market can put traders in positions that are difficult to exit.
One of the key factors affecting liquidity in the cryptocurrency market are trading volumes. You can check out any cryptocurrency market cap rankings website to see daily volumes, with a higher volume indicating that more people are buying and selling token. Exhibit 1 shows the liquidity of constituents of the MVIS CryptoCompare Digital Assets 100 Index (ticker: MVDA) universe and highlights a few interesting aspects of the crypto market. If we compare the market today with 3 years ago, we’ll see a significant improvement in trading volume.
First, as of January 2019, there were 32coins with a one-month average daily trading volume of smaller than USD 1 million. In 2022, just 5 coins weren’t able to pass the USD 1 million hurdle. While in 2019 most of the coins traded in the USD 1 – 10 million area, in 2022 most of the coins traded between USD 100 million – 1 billion. That’s a great difference and shows, that the crypto market has grown rapidly not only in size, but also in terms of liquidity. The crypto market is still a new asset class, but at least it’s maturing and with continuous adoption, the numbers should improve further over time.
Avg Daily Turnover 1 Month (Top 100 ex Stablecoins)
31/01/2019-31/01/2022
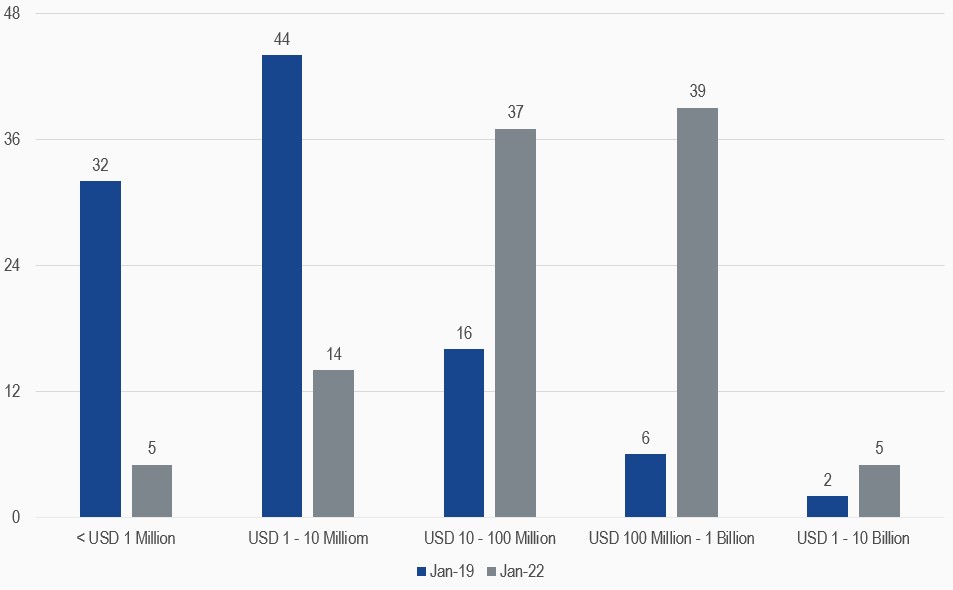
Source: MV Index Solutions. All values are rebased to 100. Data as of 31 January 2022.
Get the latest news & insights from MarketVector
Get the newsletterRelated:
Most popular
-
 Commentary
Goal! Small Country, Big Impact
-
 Commentary
Hidden GEMs: Ukraine