
Cryptocurrency markets are still in their infancy and are susceptible to extreme volatility and bubble-like price patterns. Their prices tend not to follow efficient market behaviour which is generally assumed for developed markets. The price patterns of cryptocurrencies make a standard market value-weighted approach sub-optimal for indexation. Alternatively, dynamic, risk-optimised allocation schemes can generate superior returns on cryptocurrency markets over medium to long-term time horizons.
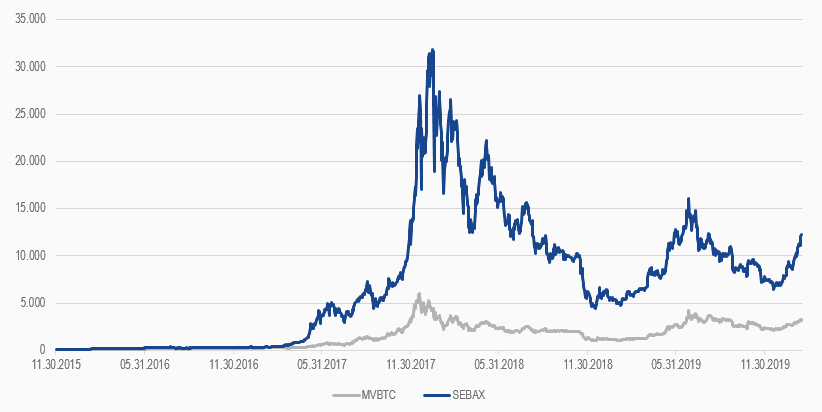
SEBAX vs. MVBTC since SEBAX Inception
| November 30, 2015 - February 14, 2020 | ||
|---|---|---|
| SEBAX | MVBTC | |
| Return (annualised) | 213.66% | 119.74% |
| Volatility (annualised) | 91.45% | 75.54% |
| Sharpe Ratio | 2.34 | 1.59 |
| Max Drawdown | -86% | -83% |
| VaR (1d,99%) | -13.61% | -11.51% |
| Conditional VaR(1d, 99%) | -18.76% | -13.69% |
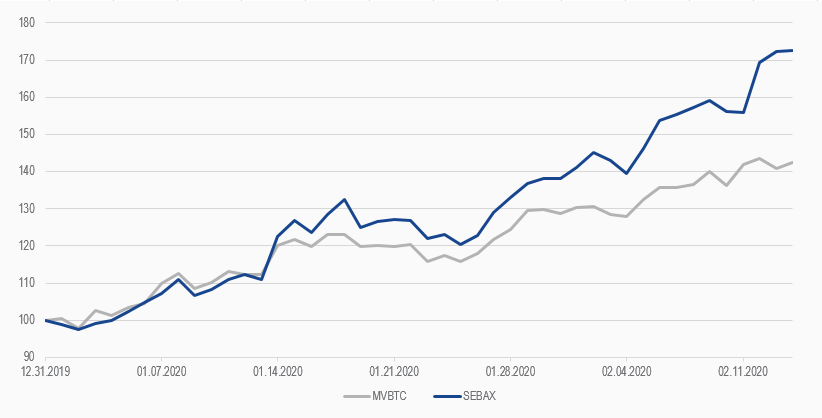
SEBAX vs. MVBTC YTD
| December 31, 2019 - February 14, 2020 | ||
|---|---|---|
| SEBAX | MVBTC | |
| Return | 72.56% | 41.98% |
| Volatility (annualised) | 57.30% | 45.16% |
| Sharpe Ratio | 1.27 | 0.93 |
| Max Drawdown | -9% | -6% |
| VaR (1d,99%) | -2.46% | -3.59% |
| Conditional VaR (1d,99%) | -3.92% | -8.55% |
Get the latest news & insights from MarketVector
Get the newsletterRelated:
Most popular
-
 Commentary
Goal! Small Country, Big Impact
-
 Commentary
Hidden GEMs: Ukraine