A Data-Driven Autopsy of Strategy's Post-Options Collapse
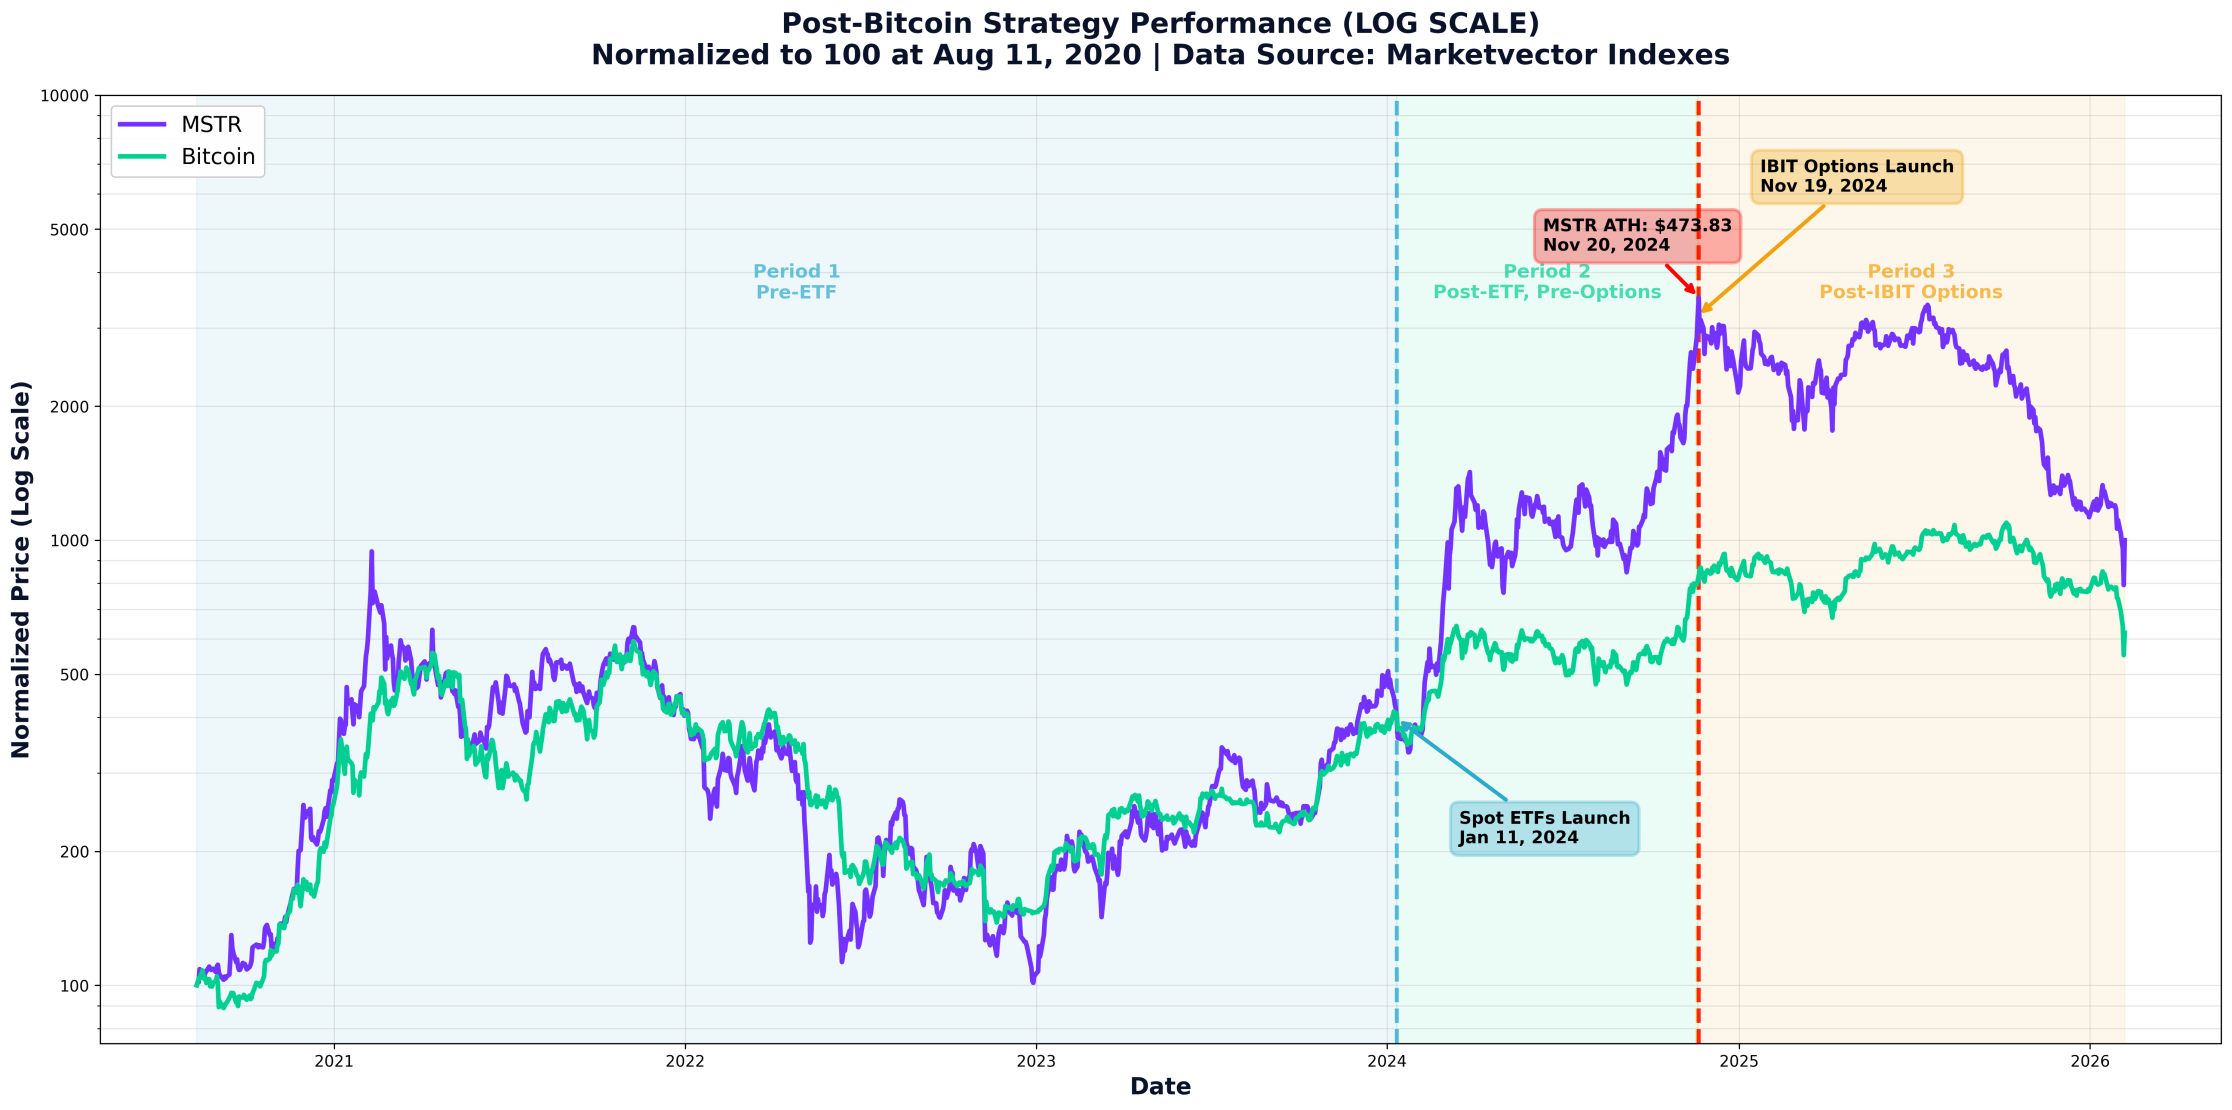
On November 19, 2024, Bitcoin ETF options began trading. Within 24 hours, MicroStrategy—which recently rebranded to simply "Strategy" -hit its all-time high of $473.83. Then came the collapse.
Since that peak, Strategy has fallen 71.5% while Bitcoin dropped 43.4%. The company now trades below the value of its Bitcoin holdings -a stunning reversal from the 229% premium it commanded just months earlier.
Did ETF options kill Strategy's business model? The data tells a fascinating story.
The Tale of Three Eras
In August 2020, Michael Saylor made a bet that would redefine corporate treasury strategy: the company (then MicroStrategy, now Strategy) would convert cash reserves into Bitcoin.
Five and a half years later, with 714,644 BTC worth $49.6 billion, the question isn't whether the strategy worked -it clearly did. The more interesting question is: Has MSTR stock outperformed simply holding Bitcoin?
The answer, it turns out, depends entirely on when you're asking.
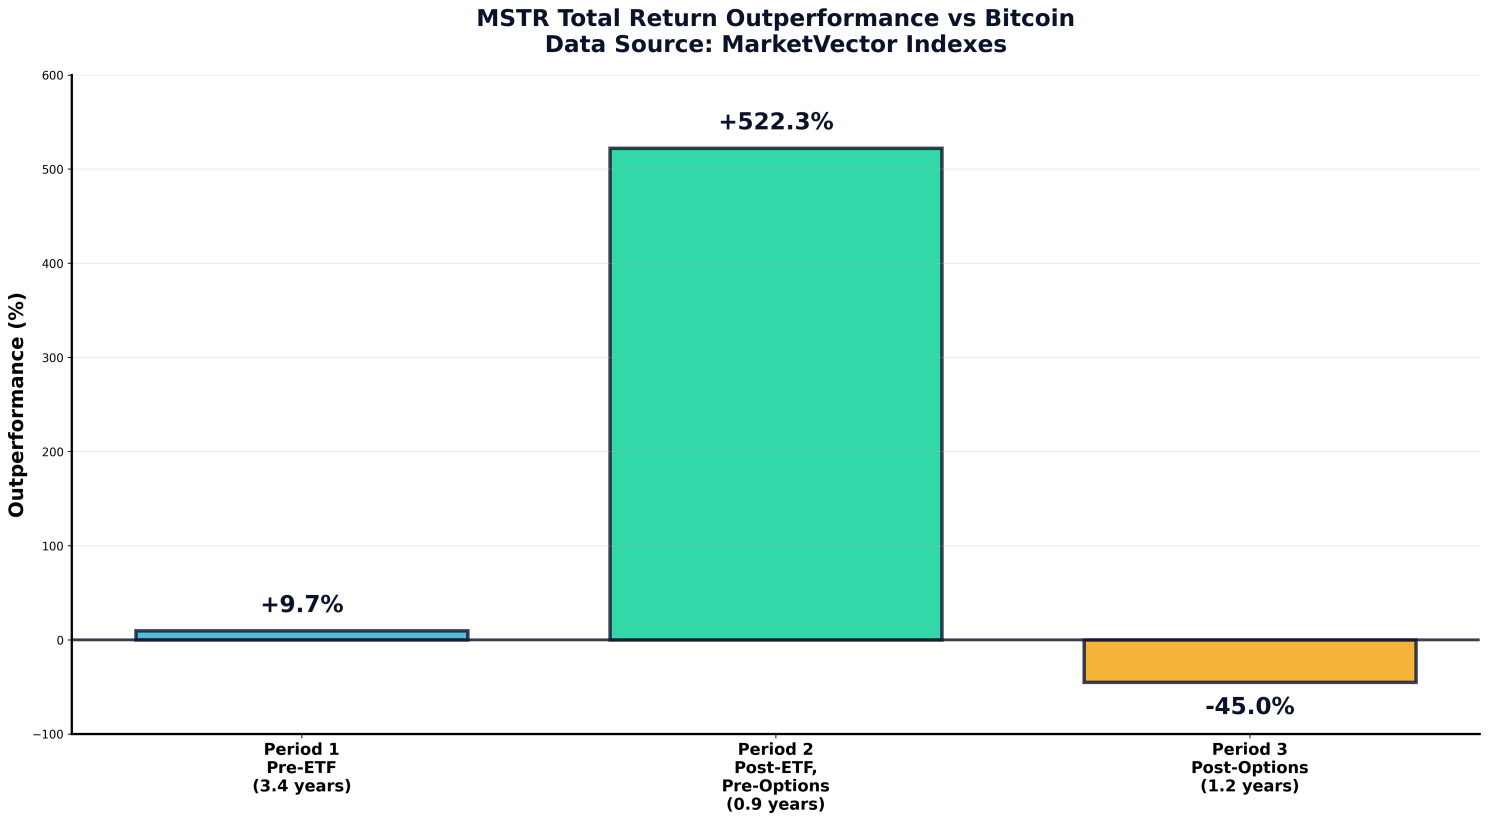
After analyzing 1,380 trading days of data, Strategy's Bitcoin journey breaks into three distinct periods, each with radically different performance:
Period 1: The Foundation (Aug 2020 - Jan 2024)
When Saylor announced the first Bitcoin purchase, the market was skeptical. The performance? Underwhelming.
The Numbers:
- MSTR returned +319%
- Bitcoin returned +310%
- Outperformance: +9.7%
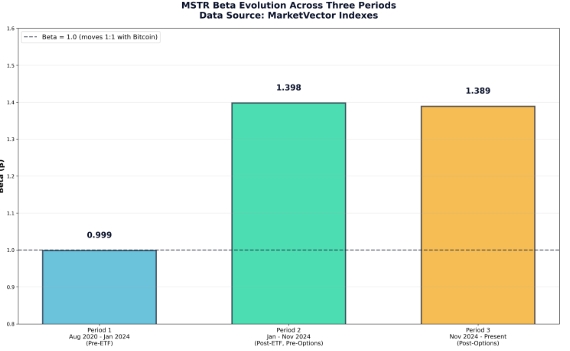
Over 3.4 years, that's essentially a rounding error. MSTR moved in lockstep with Bitcoin (beta: 1.00), but with 44% higher volatility. It was an amplified Bitcoin proxy, nothing more.

Period 2: The Golden Age (Jan - Nov 2024)
Then something extraordinary happened. Spot Bitcoin ETFs launched in January 2024, and Strategy exploded.
The Numbers:
- MSTR returned +618% in 10 months
- Bitcoin returned +95%
- Outperformance: +522%
MSTR delivered 6.5x Bitcoin's return in less than a year.
Why? Even with ETFs providing direct Bitcoin access, MSTR remained the only way to get regulated, amplified Bitcoin exposure. Want 1.4x Bitcoin's upside in your brokerage account? MSTR was your only option.
The market priced this scarcity aggressively. The MSTR/HODL ratio, simply MSTR's stock price divided by HODL's stock price (VanEck's Bitcoin ETF) climbed from 2.0 to 8.82.
MSTR's stock price rose 4.4x relative to HODL's during this period, capturing the massive outperformance in a single metric.
The numbers justified it:
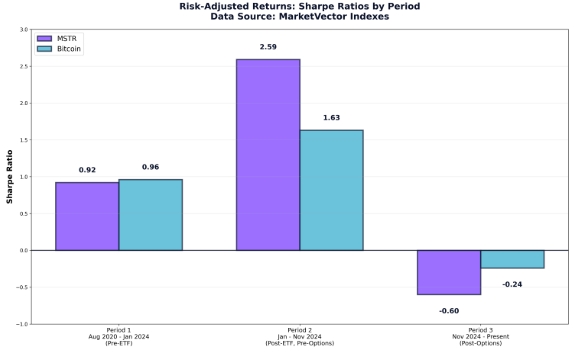
- Risk-adjusted returns (Sharpe ratio): 2.59 vs Bitcoin's 1.63
- Upside capture: 162% (captured 62% MORE on up days)
- Downside capture: 116% (only fell 16% more on down days)
Period 2 was Strategy's golden age.
Period 3: The New Reality (Nov 2024 - Present)
On November 19, 2024, Bitcoin ETF options (on IBIT ETF) began trading. The next day, Strategy hit its all-time high of $473.83. Then both collapsed.
The Numbers:
- MSTR has returned -68.7%
- Bitcoin has returned -23.6%
- Underperformance: -45.0%
The MSTR/HODL ratio fell 61% from 8.82 to 3.40, a clear signal that MSTR's stock was underperforming Bitcoin dramatically.
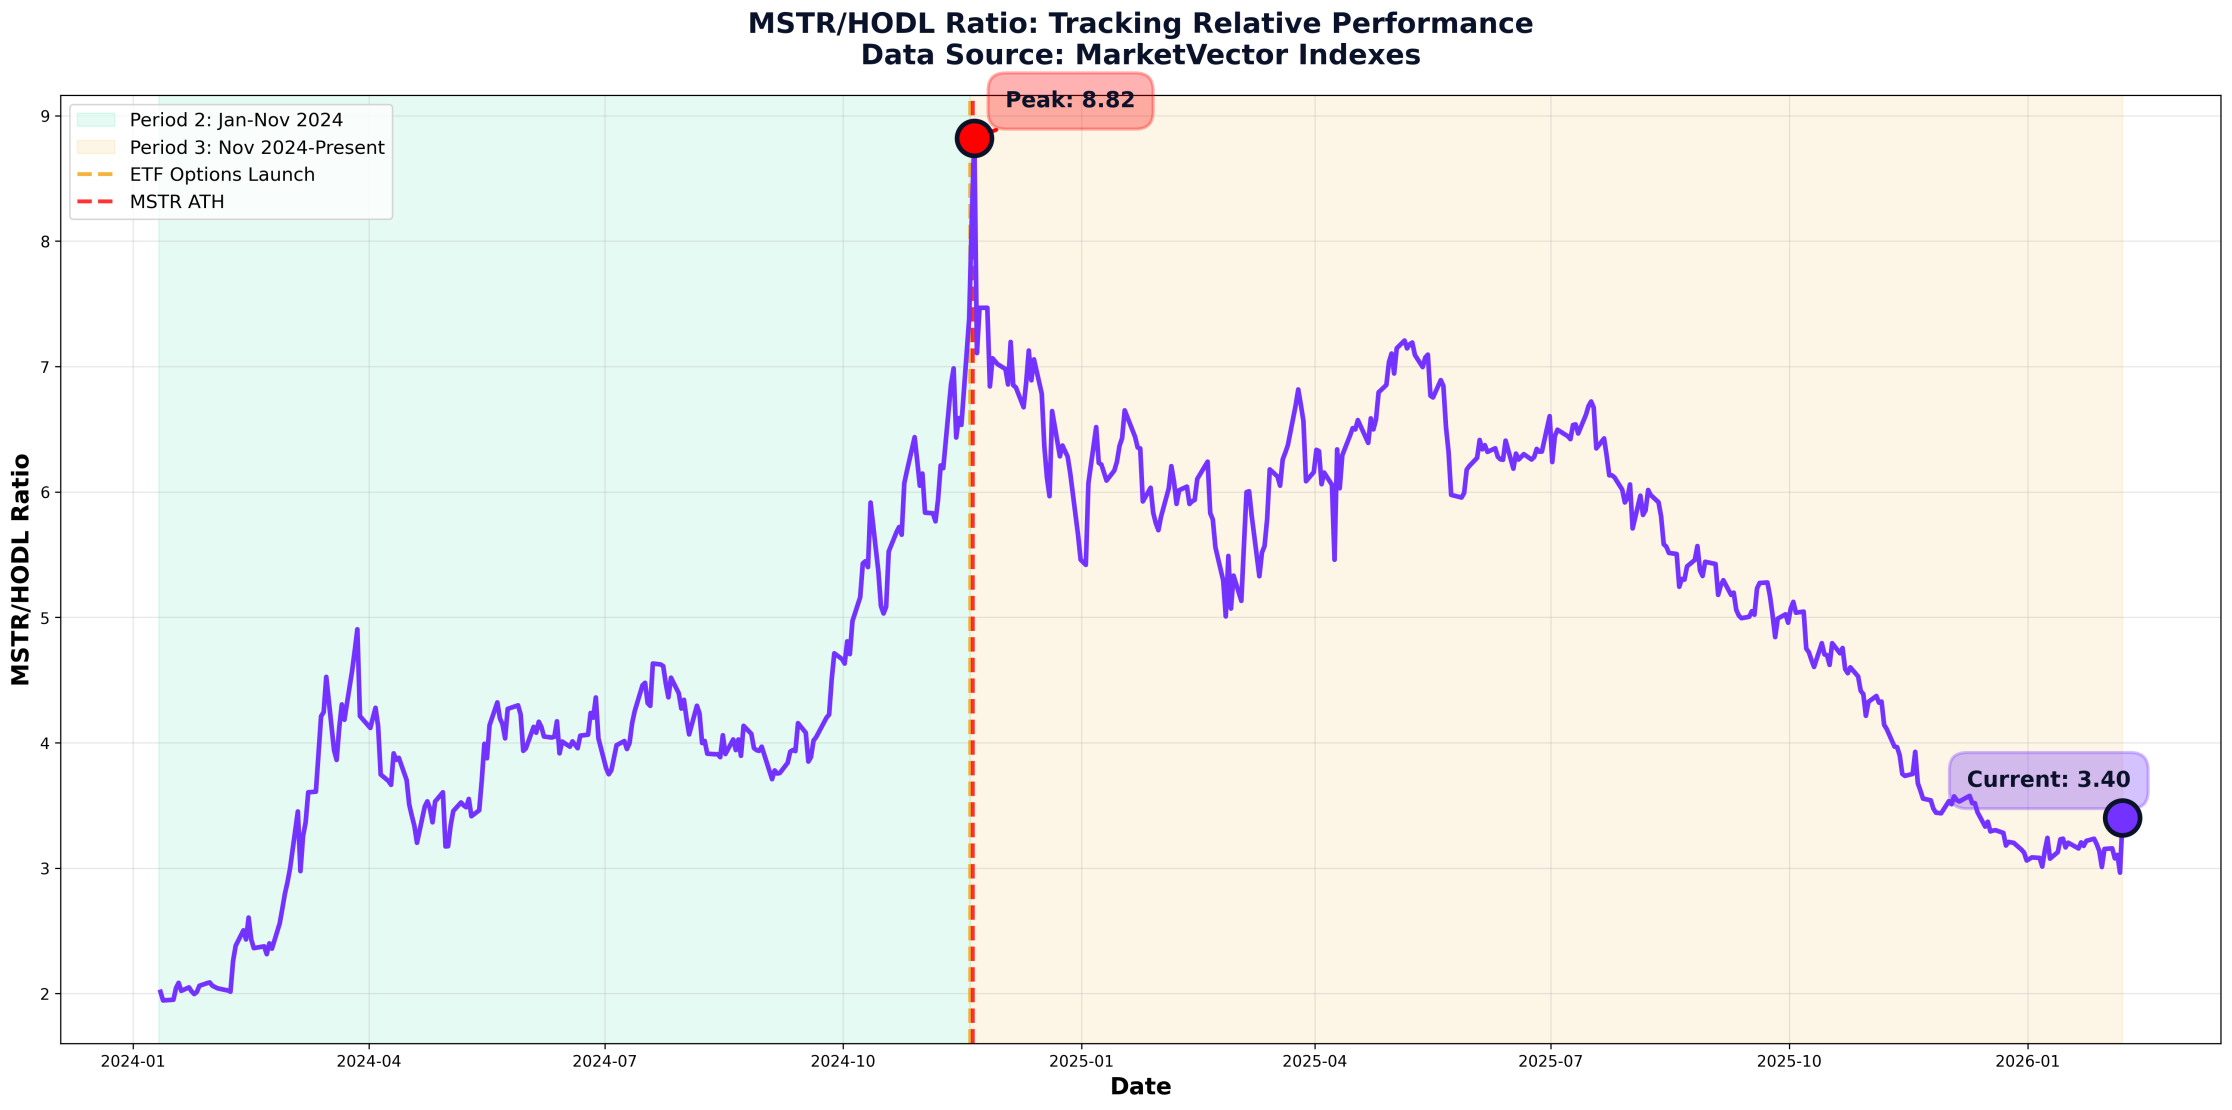
What changed? ETF options removed MSTR's monopoly on amplified exposure. Investors could now buy call options for cheaper beta, use margin on ETFs, or deploy various options strategies, all without company-specific risk.
The market repriced MSTR accordingly. The ratio's collapse from 8.82 to 3.40 tells the story: MSTR went from dramatically outperforming Bitcoin to dramatically underperforming it.
The Premium Collapse: Now Trading Below NAV
Here's the most striking finding from the data: When we look at MSTR's actual market capitalization versus its Bitcoin holdings value, the story becomes even more dramatic.
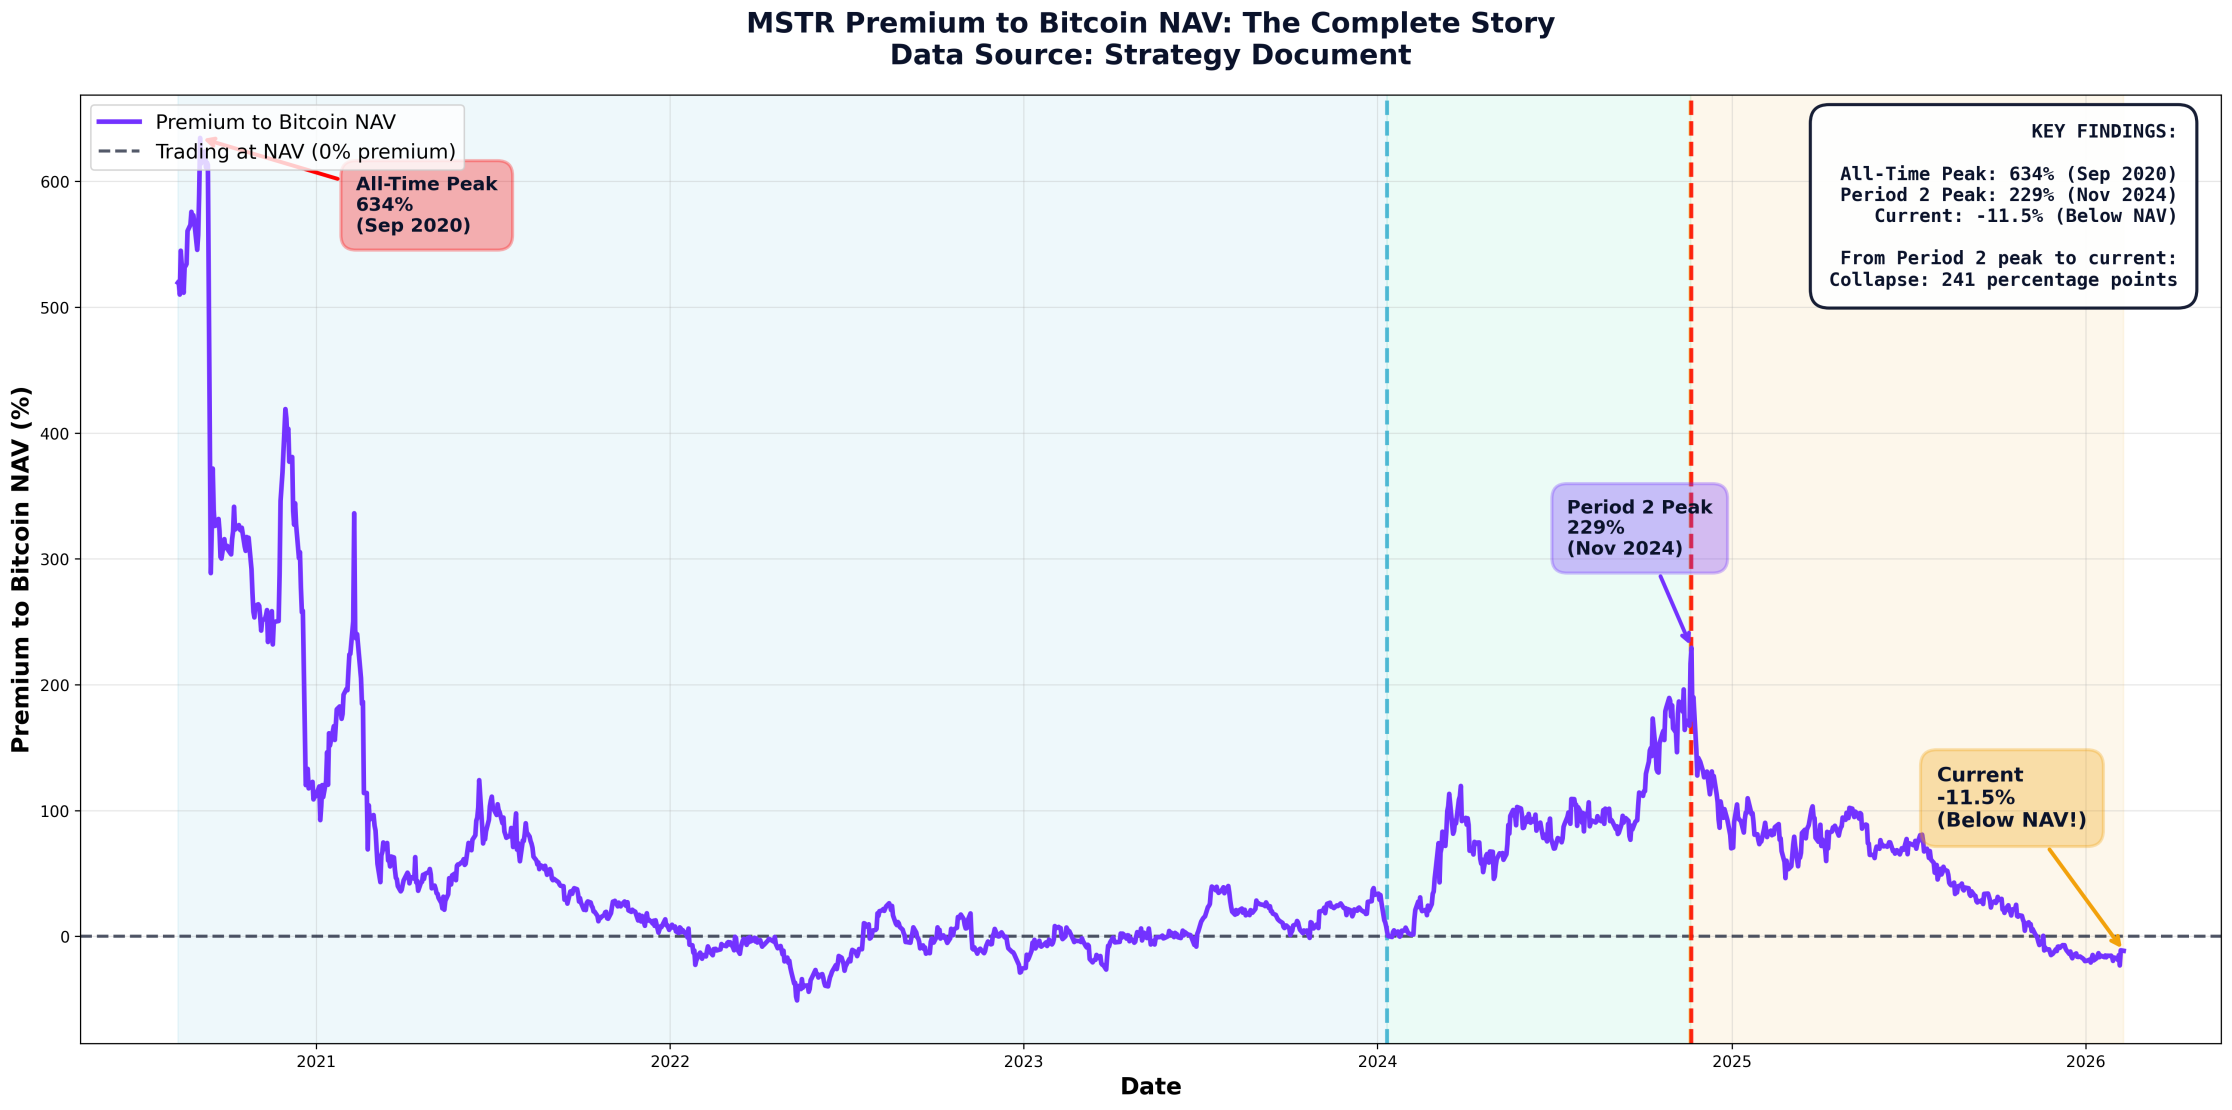
The all-time peak (September 2020):
- Market Cap: $1.6 billion
- Bitcoin Holdings Value: $0.2 billion (just 21K BTC)
- Premium: 634%
Right after announcing the Bitcoin strategy, the market valued MSTR at 7.3x its Bitcoin holdings, pure speculative excitement about the unprecedented corporate treasury move.
Period 2 peak (November 20, 2024):
- Market Cap: $106.5 billion
- Bitcoin Holdings Value: $32.3 billion (331,200 BTC × $97,611)
- Premium: 229%
During the "Golden Age," investors valued MSTR at 3.3x its Bitcoin holdings, paying a substantial premium for the operational leverage and being the only high-beta vehicle available.
Today:
- Market Cap: $43.9 billion
- Bitcoin Holdings Value: $49.6 billion (714,644 BTC × $69,354)
- Premium: -11.5%
MSTR is now trading below its Bitcoin NAV. The market is saying that MSTR's corporate wrapper, the $8.2B debt, the structure, the dilution risk, actually destroys value rather than creates it.
Let that sink in: You can buy MSTR stock and effectively acquire Bitcoin at an 11.5% discount to spot price, but you also assume the company's debt obligations, preferred stock claims, and operational risks.
From Period 2's peak to now: a 240 percentage point collapse (229% → -11.5%).
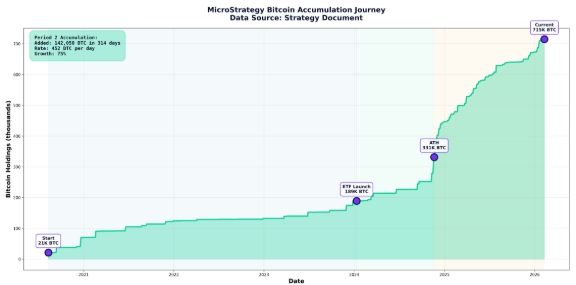
The accumulation story: MSTR acquired 452 BTC per day during Period 2, growing holdings from 189K to 331K BTC (75% growth in 10 months). Today they hold 714K BTC, more than double the peak amount.
What's Driving the Beta? Debt, Not ETFs
MSTR's beta increased due to debt issuance, not the ETF launch.
The evidence from 2024:
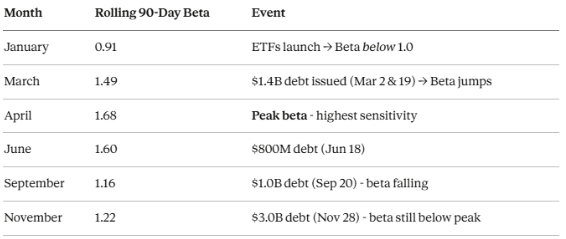
Wait—why did beta fall from April to September despite $1.8B in additional debt?
Because beta measures correlation, not just leverage. In summer/fall 2024, MSTR started moving on company-specific factors (ETF competition, premium compression) rather than pure Bitcoin sensitivity. The stock was underperforming Bitcoin for reasons beyond leverage. It was losing its scarcity premium. By November, even the massive $3B raise couldn't push beta back to April's peak. The market had changed.
Between August 2020 and February 2025, Strategy accumulated $8.2 billion in convertible debt. In 2024 alone they raised $6.2 billion.
The mechanism is simple math:
Lower financial leverage: $1 equity + $0.20 debt = $1.20 Bitcoin exposure → 10% BTC move = 12% equity move (beta ≈ 1.2) Higher financial leverage: $1 equity + $0.70 debt = $1.70 Bitcoin exposure → 10% BTC move = 17% equity move (beta ≈ 1.7)
Financial leverage (debt on the balance sheet) drives beta (stock price sensitivity).
The ETF's role? It made debt easier to raise by driving Bitcoin's price higher (better collateral), legitimizing Bitcoin institutionally (lower perceived risk), and proving demand (lender confidence). But the ETF didn't directly create beta - debt did.
The Alpha Story: From +151% to -36%
Alpha measures returns BEYOND what beta predicts. Think of it this way: beta tells you what MSTR should return based on Bitcoin's moves, alpha tells you what it actually returned.
A concrete example:
In Period 2, Bitcoin returned +95%. With MSTR's 1.40x beta, you'd expect: 1.40 × 95% = 133% return from leverage alone.
But MSTR actually returned +618%.
Where did that extra 485 percentage points come from? That's alpha, the "scarcity premium" investors paid because MSTR was the only high-beta option available. When calculated via regression: +151% annually.
Fast forward to Period 3:
Bitcoin returned -23.6%. With 1.39x beta, you'd expect: 1.39 × -23.6% = -33% loss from leverage. But MSTR actually returned -68.7%.
That extra -35 percentage points of losses? That's negative alpha, the premium compression destroying value beyond what beta explains. When calculated via regression: -36% annually.
That's a 187 percentage point swing between Period 2 and Period 3.
Period 2's +151% alpha represented genuine value creation—MSTR added returns beyond its leverage.
Period 3's -36% alpha represents value destruction—MSTR loses more than its leverage predicts, even though the beta (1.39x) stayed the same.
The Balance Sheet: Solid Fundamentals
Strategy's recent earnings call addressed the financial health question:
- $2.25 billion cash reserves
- 30 months of STRC dividend coverage
- 0.42% weighted average coupon on $8.2B debt outstanding
- Bitcoin could fall to $8,000 until 2032 before solvency issues
The point: This isn't a distressed situation. The balance sheet is sound. The company has substantial financial leverage (debt), but it's well-managed with extremely low borrowing costs.
However: Solvency and attractive relative performance are separate questions. MSTR can be financially healthy while underperforming Bitcoin, which is exactly what's happening in Period 3.
The STRC Angle: A Different Play Entirely
Here's what often gets overlooked: Strategy's STRC (Stretch) preferred stock represents a fundamentally different proposition.
What is STRC?
- Perpetual preferred stock
- ~11% dividend yield
- Backed by Bitcoin holdings
- Vastly lower volatility than MSTR equity
In Period 3, while MSTR equity fell 68.7%, STRC holders collected 11% annually with minimal price volatility.
The emerging business model: If Strategy successfully scales STRC to $10B+, they're creating a Bitcoin-backed credit instrument. That's a real business generating spreads between borrowing costs (0.42% weighted average) and dividend yields (11%)—a 10.6% margin.
Management emphasized STRC's potential in their earnings call. For investors seeking Bitcoin exposure with yield instead of volatility, STRC represents a new category entirely.
When Could MSTR Outperform Again?
Based on the data patterns, three paths could restore outperformance:
1. Significant Bitcoin Rally
MSTR's 1.39x beta means a 50% Bitcoin rally translates to ~70% MSTR gain (before alpha). If Bitcoin surges 100-200%, the beta amplification could overcome negative alpha through magnitude alone.
2. Competitive Landscape Shifts
If Bitcoin ETF options liquidity proves insufficient, or regulatory changes disadvantage ETFs versus corporate holders, MSTR could reclaim its unique positioning. Currently, competition appears to be growing, not shrinking.
3. STRC Scales Successfully
If STRC becomes the dominant product, MSTR might rerate as the equity layer of a Bitcoin-backed credit business, not as a high-beta Bitcoin play. This would take years, not quarters.
Base case: Absent major catalysts, MSTR likely continues delivering roughly 1.4x Bitcoin's returns (give or take alpha fluctuations) while trading at 3-4x HODL.
Why MSTR Still Matters Despite Competition
The availability of Bitcoin ETF options has made MSTR's outperformance structurally harder. But MSTR retains relevance for specific cohorts:
1. Restricted Accounts: Many pension funds, endowments, and retail accounts cannot access options. MSTR remains their only high-beta Bitcoin vehicle.
2. Permanent Capital: Unlike options that expire, MSTR equity has no rollover risk or time decay.
3. Simplicity: Some investors prefer "click buy" over managing options strategies or margin.
4. Tax Considerations: Depending on account structure, MSTR may have favorable tax treatment.
These aren't small groups. They represent real sustained demand for MSTR equity despite competitive alternatives.
The Bottom Line
Strategy didn't get worse. The competitive environment got better.
The company still holds massive Bitcoin positions (714K BTC worth $49.6B), maintains operational leverage (debt-financed Bitcoin holdings driving 1.39x beta), has a strong balance sheet, and executes its strategy effectively.
What changed is that investors gained alternatives. In Period 2, MSTR was the only high-beta option. MSTR's stock rose 4.4x relative to HODL (ratio: 2.0 → 8.82), capturing massive outperformance and trading at a 229% premium to Bitcoin NAV. In Period 3, with options available, MSTR's stock fell far more than HODL (ratio: 8.82 → 3.40), reflecting severe underperformance and now trading 11.5% below Bitcoin NAV.
Is MSTR outperforming Bitcoin? Not currently. It's underperformed by 45 percentage points over 14 months and trades below the value of its Bitcoin holdings.
Could it outperform again? Absolutely. A major Bitcoin rally, competitive shifts, or STRC success could drive outperformance and re-expand the premium.
Is 3.40x expensive or cheap? With MSTR trading below NAV, you're effectively buying Bitcoin at a discount, but also assuming $8.2B in debt, dilution risk, and corporate overhead. Whether that trade-off makes sense depends on your view of the scenarios above and your access to alternatives.
For investors with Bitcoin ETF options available, MSTR's value proposition is weaker. For those restricted to equities, MSTR remains the only high-beta vehicle. For those seeking Bitcoin-backed yield, STRC is a different category entirely.
The data shows us what happened. What happens next depends on Bitcoin's direction, whether alpha turns positive, and whether Strategy can rebuild competitive advantage through STRC or innovation.
November 19, 2024 didn't just end an era—it answered a question: Can a single company maintain a monopoly on Bitcoin leverage in efficient markets?
The answer, delivered by the market in brutal fashion, was no.
About the Author(s):
Martin Leinweber leads digital asset research and strategy at MarketVector Indexes, where he develops index products, publishes institutional research, and serves as the firm's primary voice on crypto markets to a global client base. His work sits at the intersection of systematic investing and an emerging asset class, translating rigorous quantitative frameworks into actionable insight for institutional investors. Before joining MarketVector, Martin spent nearly two decades as a Portfolio Manager across equities, fixed income, and alternative investments. At Quoniam Asset Management, one of Germany's foremost quantitative houses, he managed active funds for institutional clients including insurance companies, pension funds, and sovereign wealth funds. Earlier in his career at MEAG, the asset manager of Munich Re and ERGO, he contributed to the firm's international expansion, including the establishment of a joint venture with PICC, China's largest insurance company, with operations in Shanghai and Beijing. Martin is co-author of two Wiley publications: Asset-Allokation mit Kryptoassets: Das Handbuch (2021), the first institutional handbook on integrating digital assets into traditional portfolios, and Mastering Crypto Assets: Investing in Bitcoin, Ethereum, and Beyond (2024). He holds a Master of Economics from the University of Hohenheim and is a CFA Charterholder.
IMPORTANT DEFINITIONS AND DISCLOSURES
Copyright © 2026 by MarketVector Indexes GmbH (‘MarketVector’) All rights reserved. The MarketVector family of indexes (MarketVectorTM, Bluestar®, MVIS®) is protected through various intellectual property rights and unfair competition and misappropriation laws. MVIS® is a registered trademark of Van Eck Associates Corporation that has been licensed to MarketVector. MarketVectorTM and MarketVector IndexesTM are pending trademarks of Van Eck Associates Corporation. BlueStar®, BlueStar Indexes®, BIGI®, and BIGITech® are trademarks of MarketVector Indexes GmbH.
Redistribution, reproduction, and/or photocopying in whole or in part are prohibited without written permission. All information provided by MarketVector is impersonal and not tailored to the needs of any person, entity, or group of persons. MarketVector receives compensation in connection with licensing its indexes to third parties. You require a license from MarketVector to launch any product that is linked to a MarketVectorTM Index to use the index data for any business purpose and all use of the MarketVectorTM name or name of the MarketVectorTM Index. The past performance of an index is not a guarantee of future results.
It is not possible to invest directly in an index. Exposure to an asset class represented by an index is available through investable instruments based on that index. MarketVector does not sponsor, endorse, sell, promote, or manage any investment fund or other investment vehicle that is offered by third parties and that seeks to provide an investment return based on the performance of any index. MarketVector makes no assurance that investment products based on the index will accurately track index performance or provide positive investment returns. MarketVector is not an investment advisor, and it makes no representation regarding the advisability of investing in any such investment fund or other investment vehicle. A decision to invest in any such investment fund or other investment vehicle should not be made in reliance on any of the statements set forth in this document.
Investments into cryptocurrencies and/or digital assets are subject to material and high risk including the risk of total loss. The calculated prices may not be achieved by investors as the calculated price is based on prices from different trading platforms. Furthermore, an investment into cryptocurrencies and/or digital assets may become illiquid depending on the trading platform or investment product used for the specific investment. Investors should carefully review all risk factors disclosed by the relevant trading platform or in the product documents of relevant investment products.
Prospective investors are advised to make an investment in any such fund or other vehicle only after carefully considering the risks associated with investing in such funds, as detailed in an offering memorandum or similar document that is prepared by or on behalf of the issuer of the investment fund or other vehicle. The inclusion of a security within an index is not a recommendation by MarketVector to buy, sell, or hold such security, nor is it considered to be investment advice.
All information shown prior to the index launch date is simulated performance data created from backtesting ("Simulated past performance”). Simulated past performance is not actual but hypothetical performance based on the same or fundamentally the same methodology that was in effect when the index was launched. Simulated past performance may materially differ from the actual performance. Actual or simulated past performance is no guarantee for future results.
These materials have been prepared solely for informational purposes based upon information generally available to the public from sources believed to be reliable. No content contained in these materials (including index data, ratings, credit-related analyses and data, model, software, or other application or output therefrom) or any part thereof (Content) may be modified, reverse-engineered, reproduced or distributed in any form by any means, or stored in a database or retrieval system, without the prior written permission of MarketVector. The Content shall not be used for any unlawful or unauthorized purposes. MarketVector and its third-party data providers and licensors (collectively “MarketVector Parties”) do not guarantee the accuracy, completeness, timeliness, or availability of the Content. MarketVector Parties are not responsible for any errors or omissions, regardless of the cause, for the results obtained from the use of the Content. THE CONTENT IS PROVIDED ON AN “AS IS” BASIS. MARKETVECTOR PARTIES DISCLAIM ANY AND ALL EXPRESS OR IMPLIED WARRANTIES, INCLUDING, BUT NOT LIMITED TO, ANY WARRANTIES OF MERCHANTABILITY OR FITNESS FOR A PARTICULAR PURPOSE OR USE, FREEDOM FROM BUGS, SOFTWARE ERRORS, OR DEFECTS, THAT THE CONTENT’S FUNCTIONING WILL BE UNINTERRUPTED OR THAT THE CONTENT WILL OPERATE WITH ANY SOFTWARE OR HARDWARE CONFIGURATION. In no event shall MarketVector Parties be liable to any party for any direct, indirect, incidental, exemplary, compensatory, punitive, special, or consequential damages, costs, expenses, legal fees, or losses (including, without limitation, lost income or lost profits and opportunity costs) in connection with any use of the Content even if advised of the possibility of such damages.
Get the latest news & insights from MarketVector
Get the newsletterRelated:
Most popular
-
 Commentary
Hidden GEMs: Ukraine
-
 Commentary
MarketVector Index(es) of the Month: Space